All posts by Carolina Acosta

WIP, 2

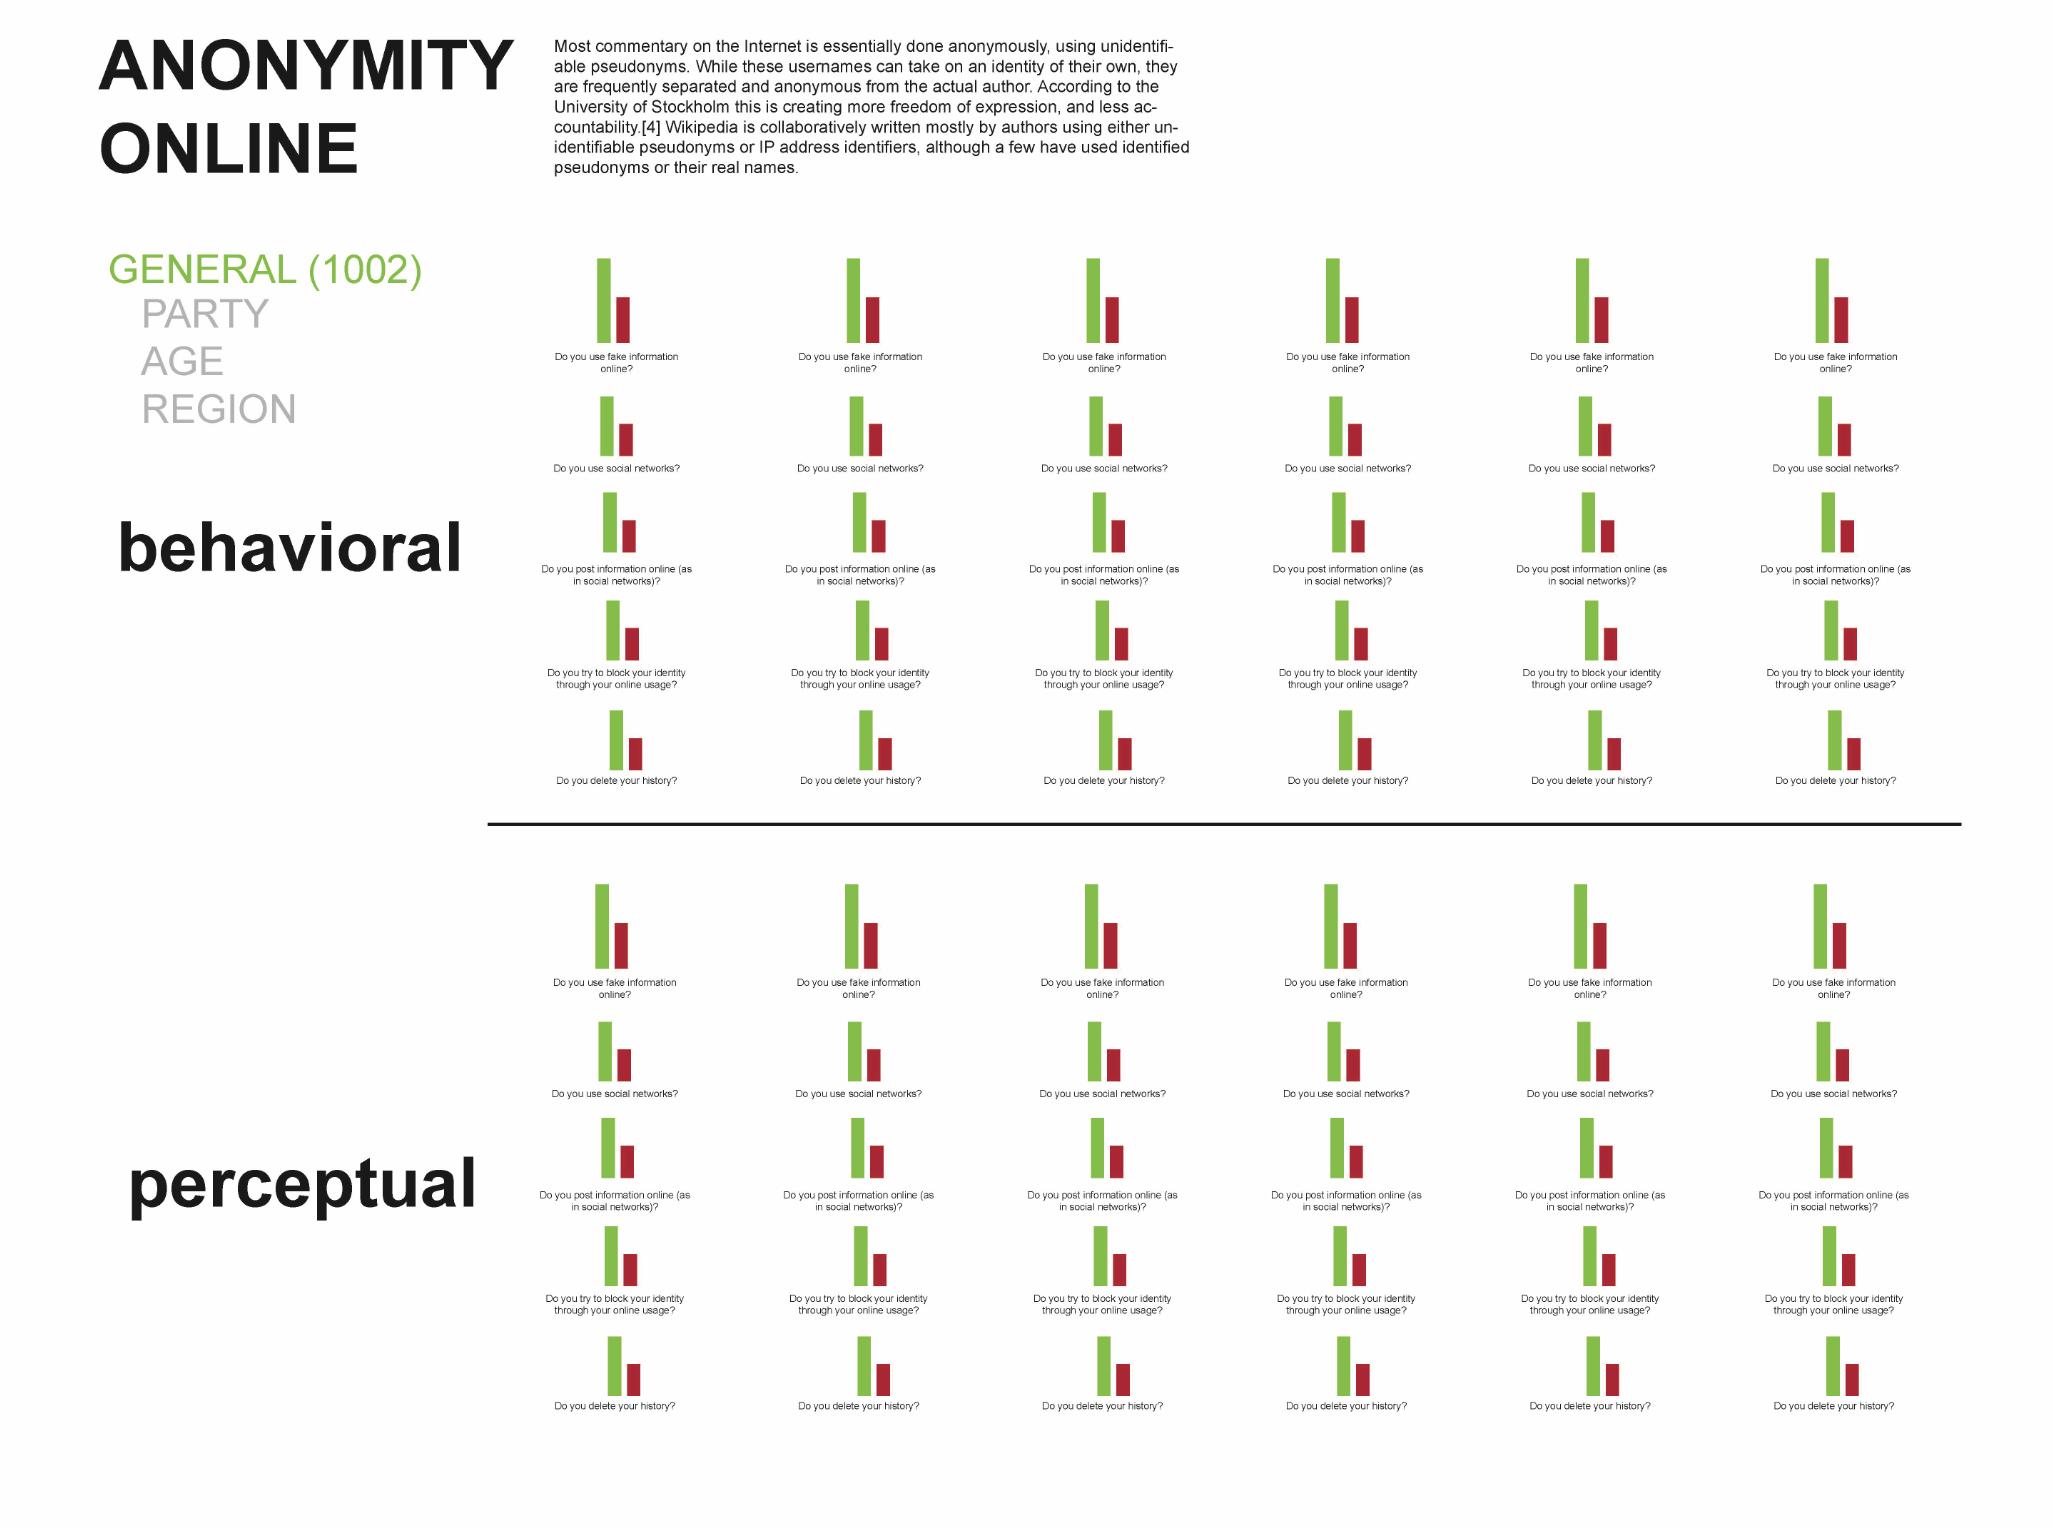
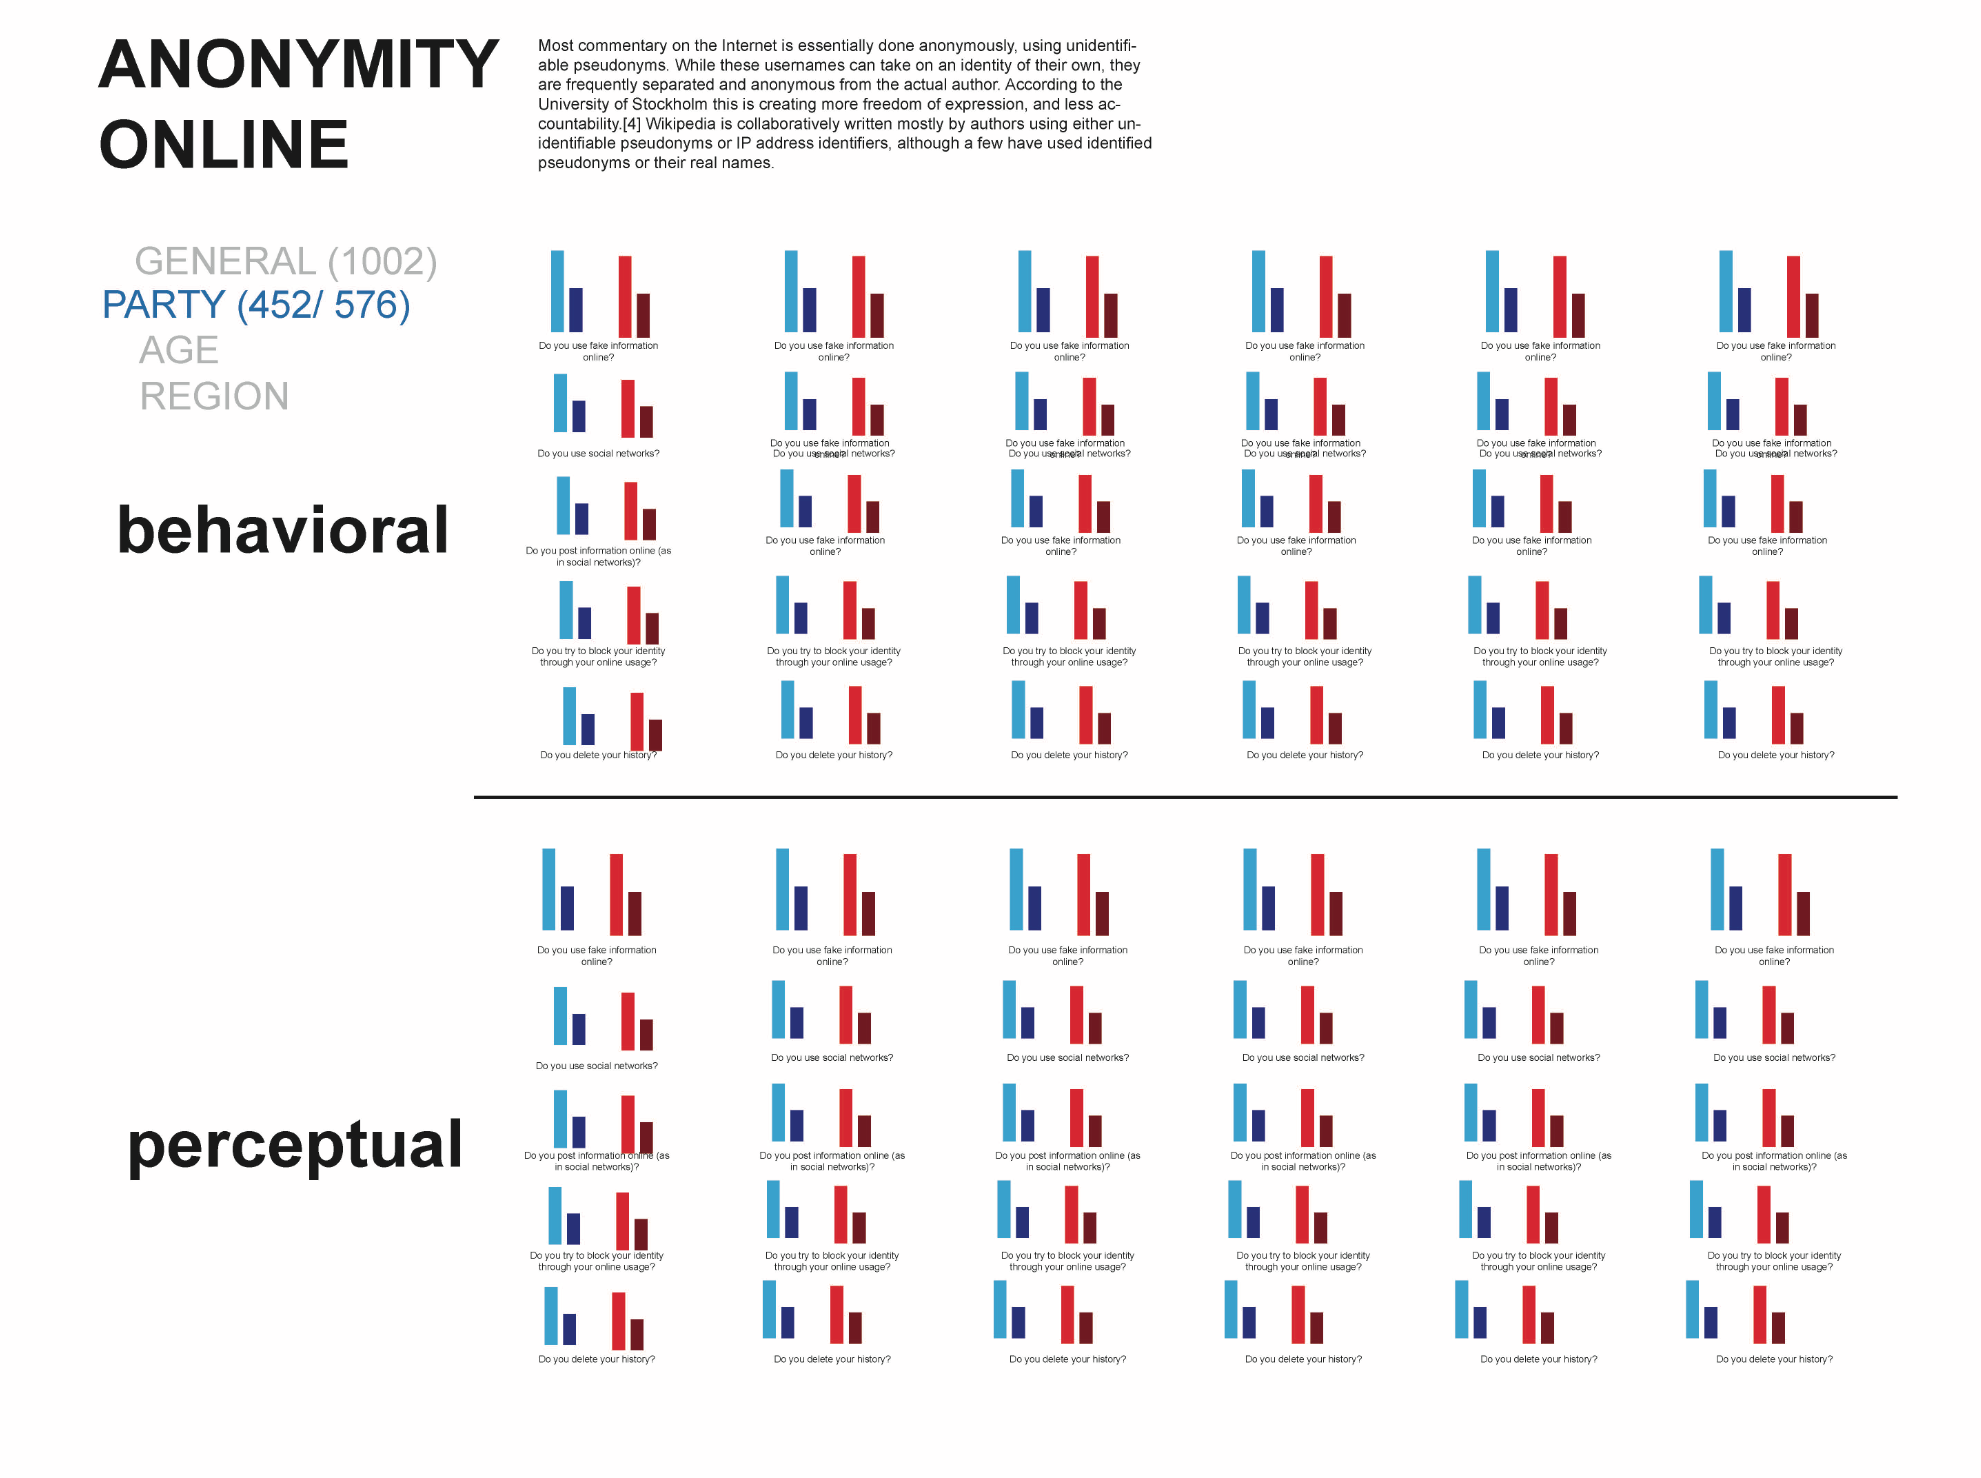
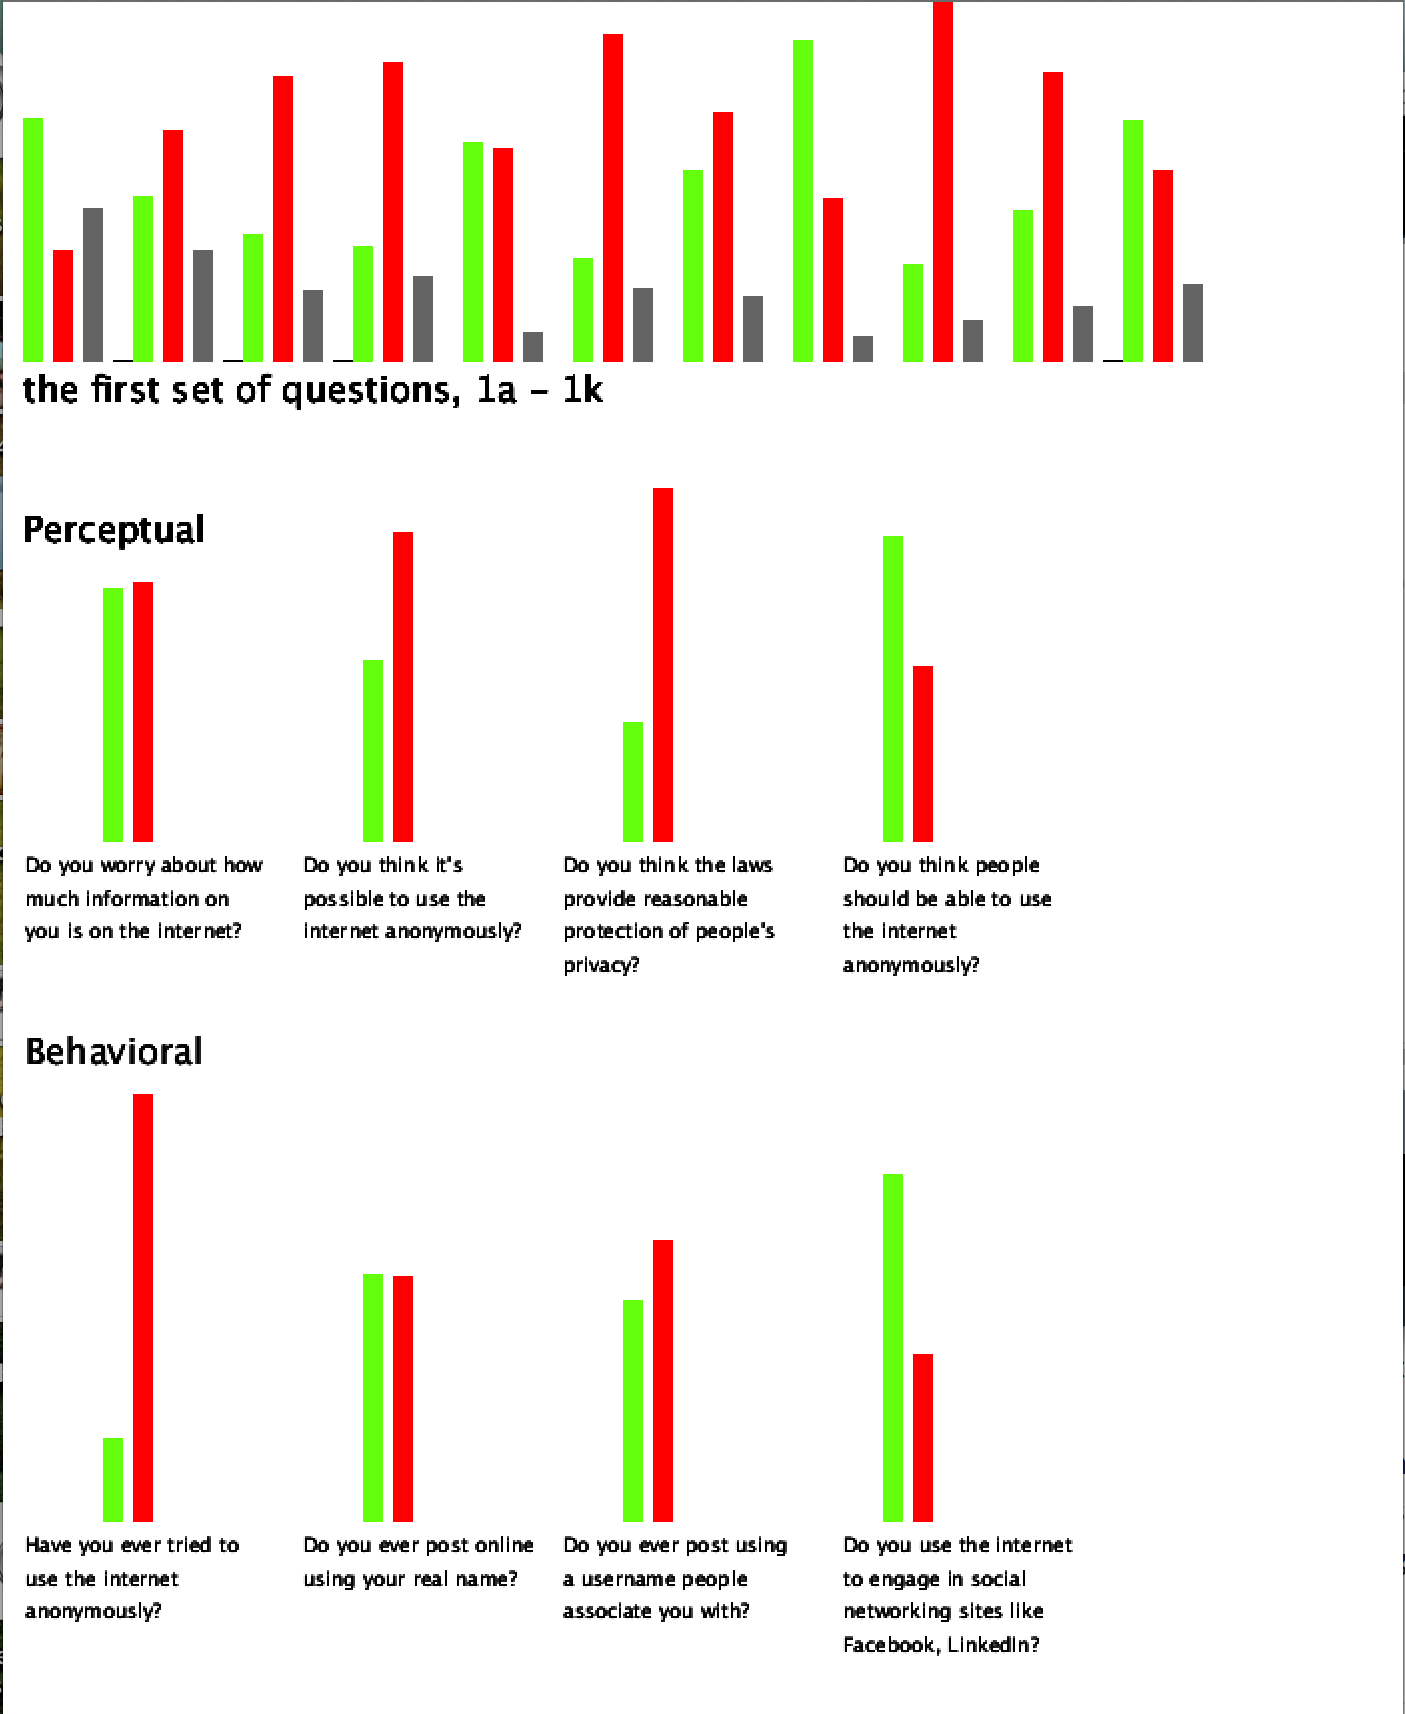
For this week, I worked on laying out my questions within their categories and coding out their graphs. I looked at the colors I’m going to be using, but I am still deciding whether I should include the maybes and refuse to reply answers, which are still part of the data yet don’t really have much use. I can’t figure out the multiple question code. I would like to make a column of Yes for any of #1’s a-k questions (for example, if there is a yes for any of these questions, count it as 1 yes). I can’t figure out the math or the logic or whatever it is I need to figure out to get that to happen. Right now, all the answers’ responses are graphed at the top of the visual. The fun part this week was multiplying components to create the many questions and I finally got the hang of not repeating numbers and creating integers. Here’s a look:

Screen Shot 2014-11-24 at 6.47.31 PM

Code

It’s kinda getting there!

Proofs of Concept, 2

For my next set of data, I am creating a series of bar graphs that analyze web anonymity behavior, experience, and beliefs of about 700 individuals. To do that, my proofs of concept are:

1. Make a bar graph for each “yes”, “no”, “not sure”, and “refuse to answer” response for each question.

1a.  Combine several questions into one; have you ever  (a,b,c,d,e,f,g) => yes, no, etc? If a = yes, b = yes, c = yes, then… make a  yes graph.

2. Place all questions in one space, see how it looks.

3. Organize data, pull out just the yes and no questions and see if they are equal in weight of behavioral and perceptual questions.

What I was able to do:

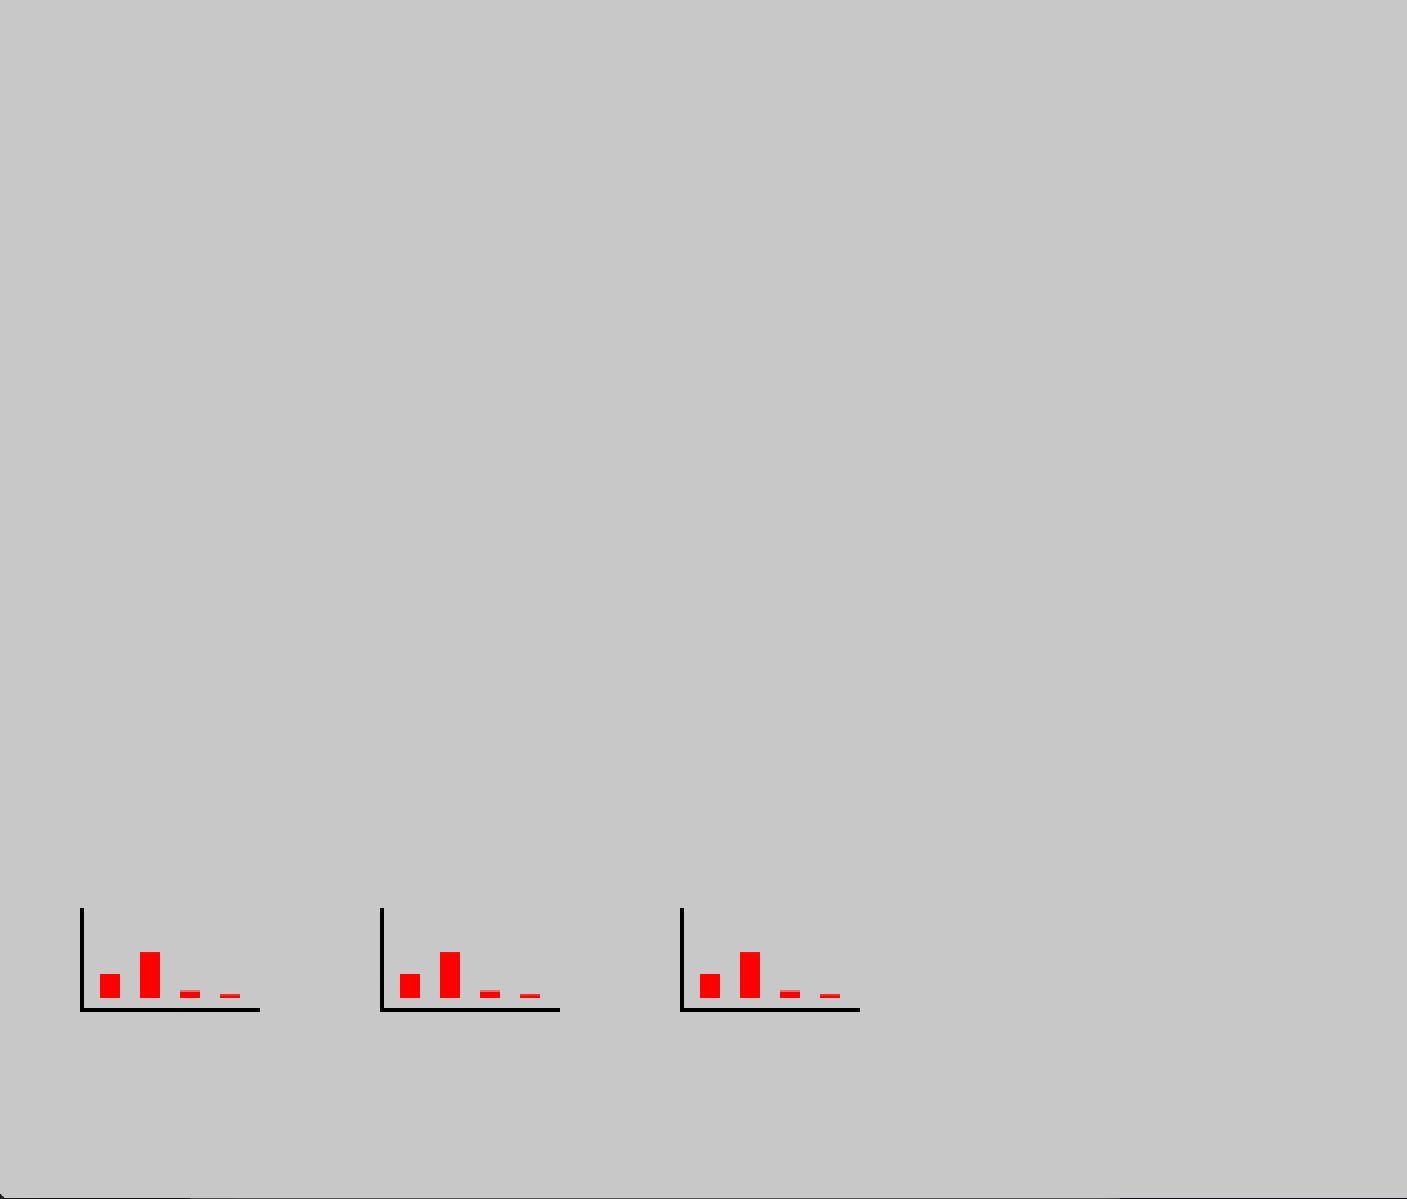
1. Can’t figure out how to let Processing count same values within a column. For example, how many times did people answer yes (or 1) to the first question? If answer = 1, then count how times 1 occurs and make a bar out of that value.

1a. ^

2. WIP

3. WIP

All I got:

Screen Shot 2014-11-17 at 5.43.20 PM

My troubled code

FINAL Documentation, 1

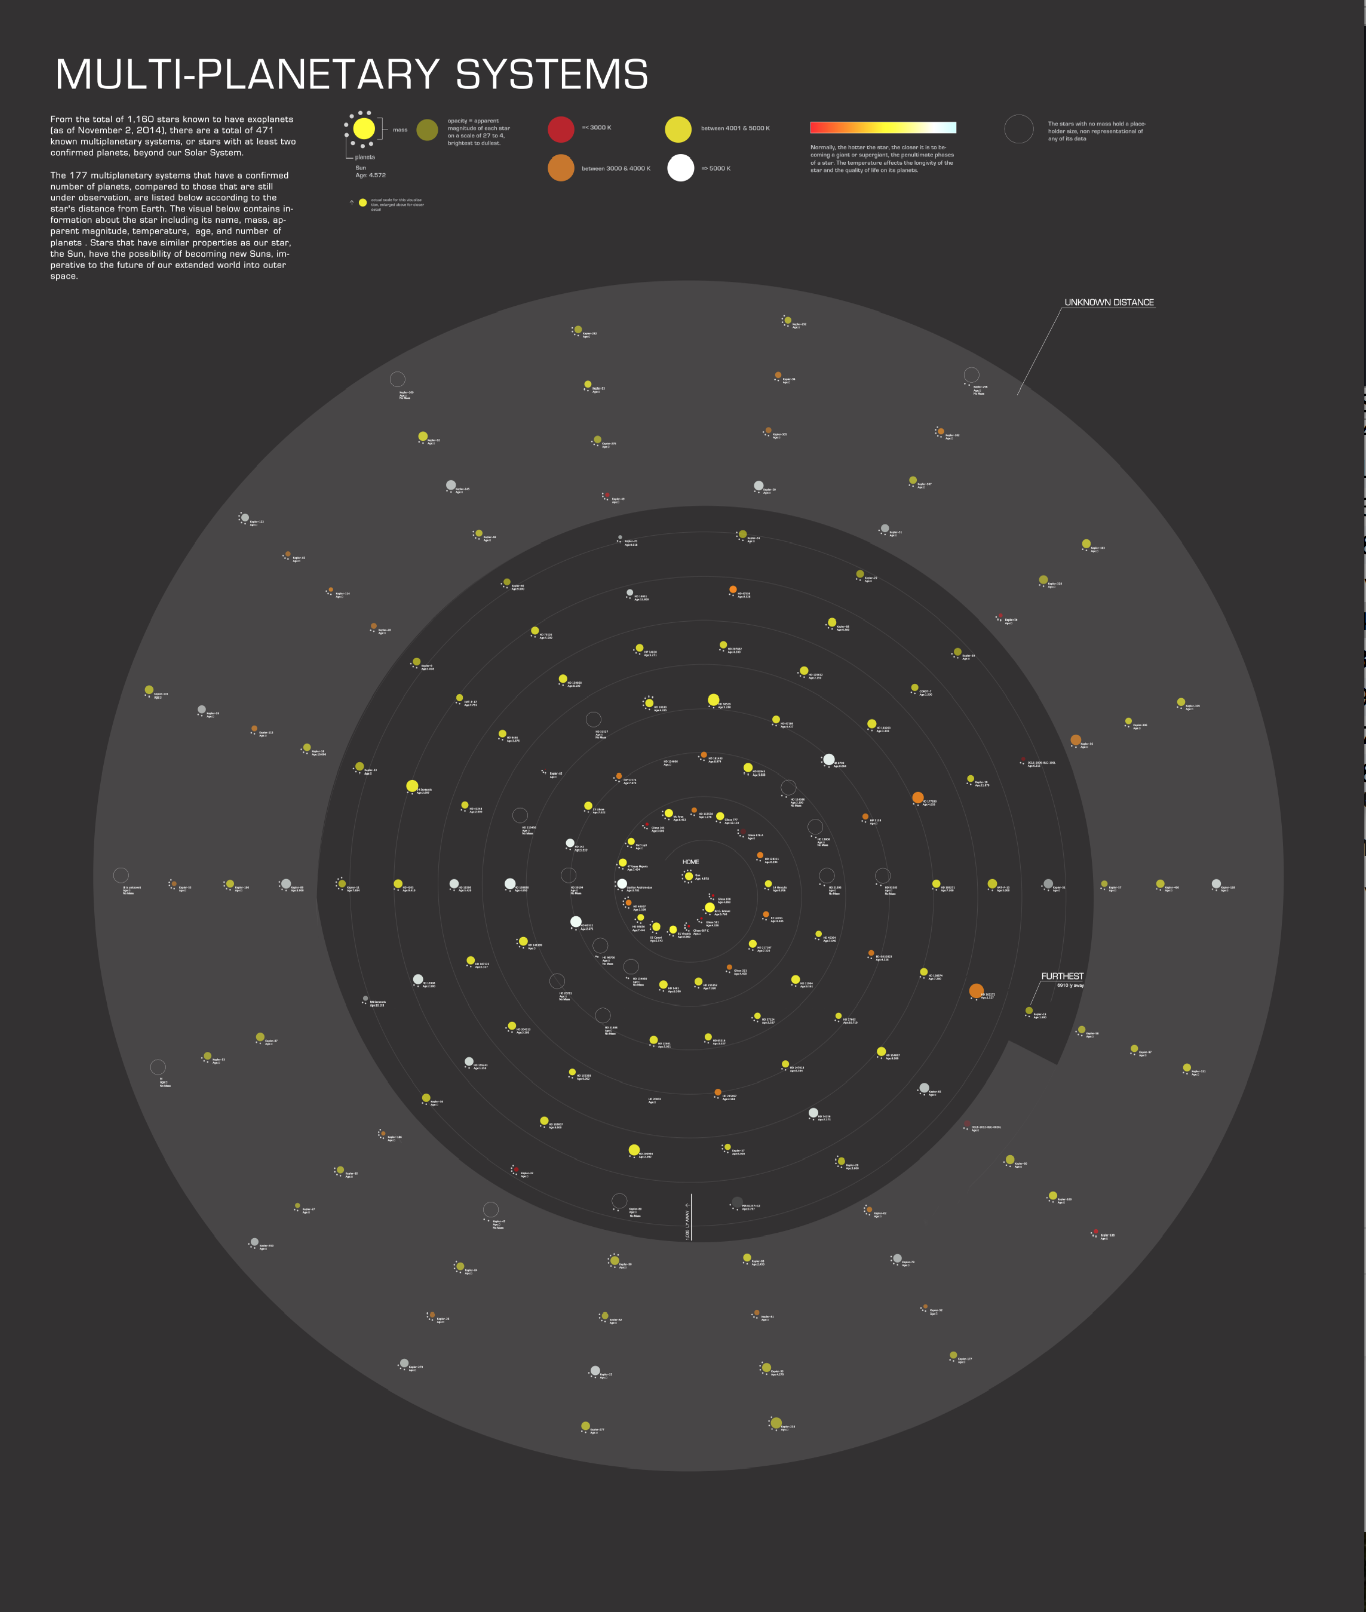
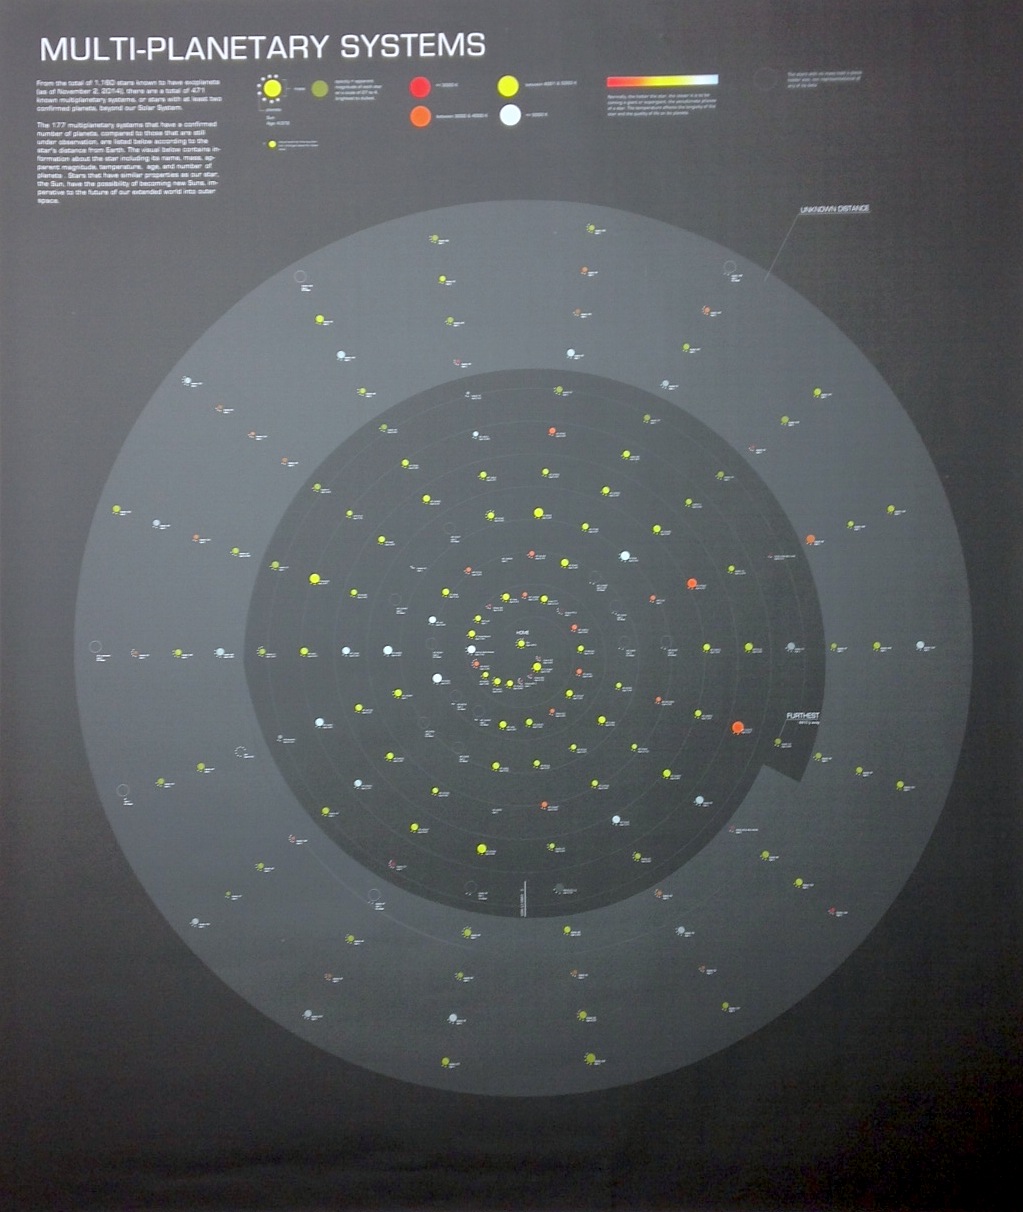
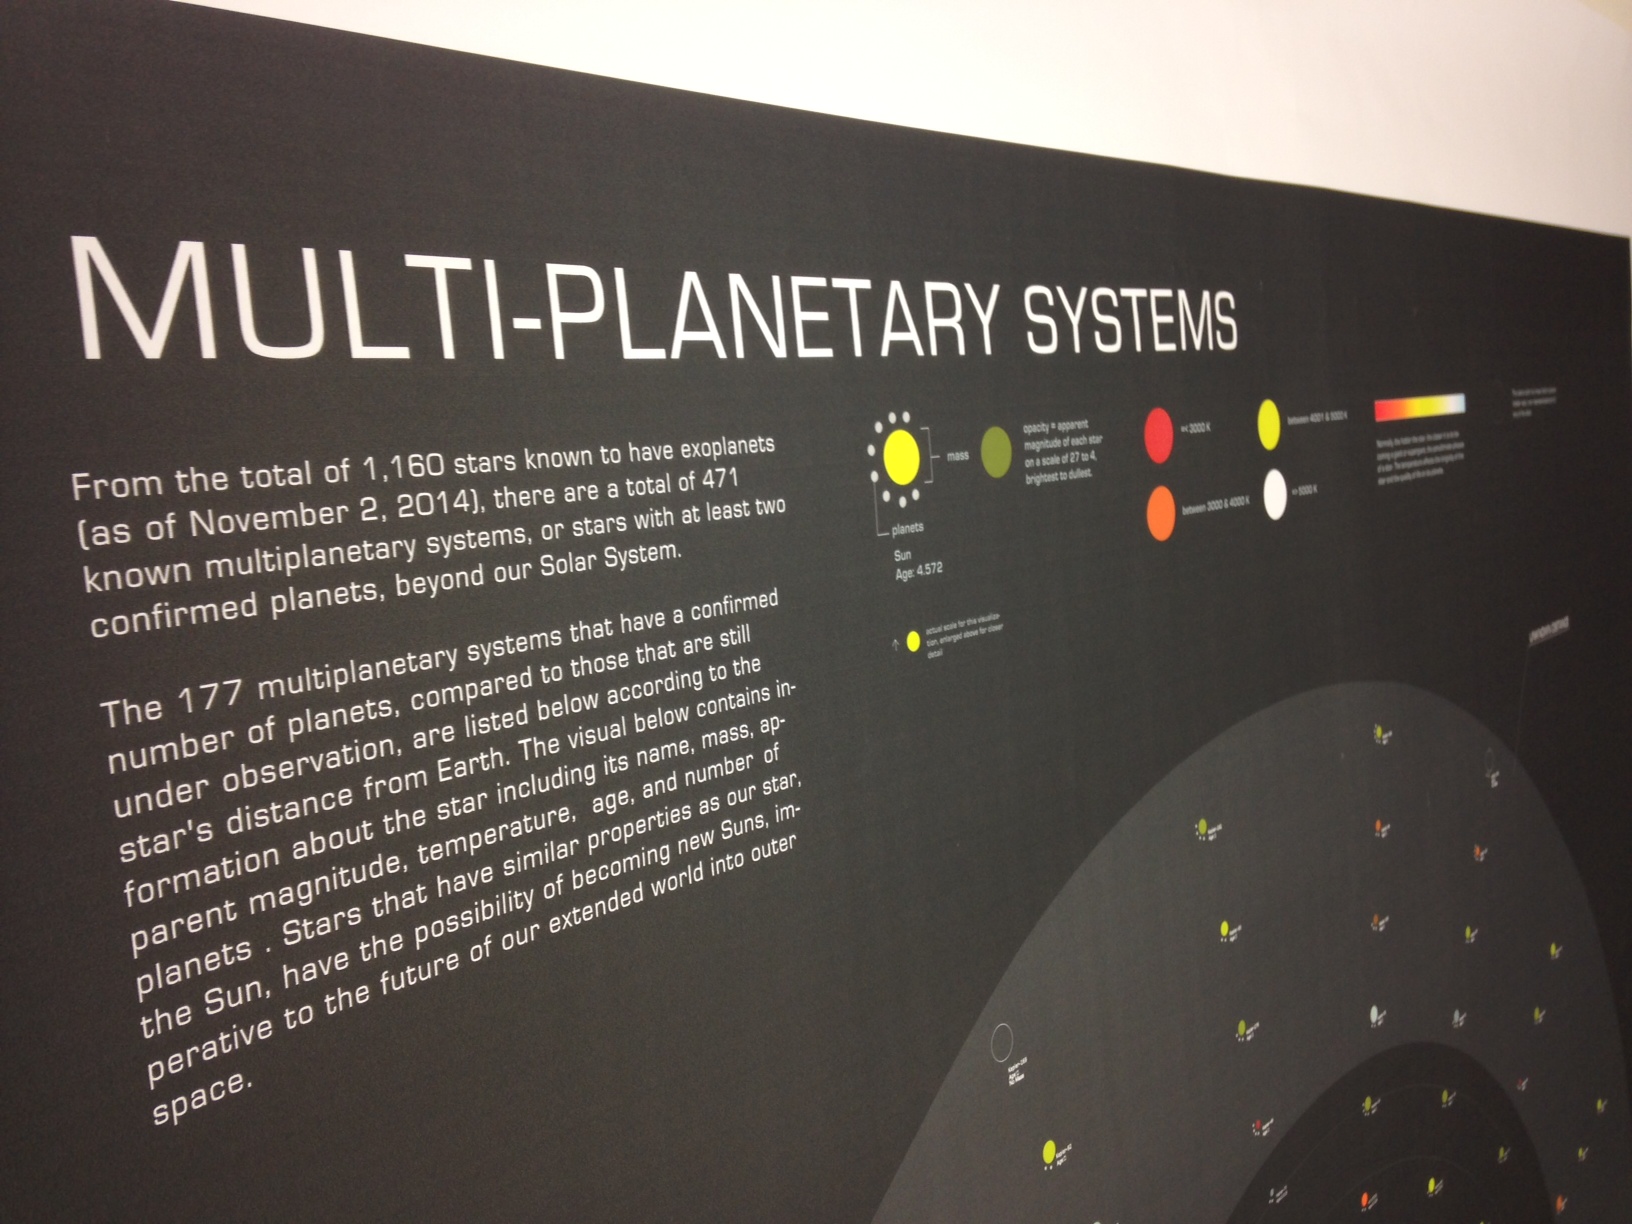
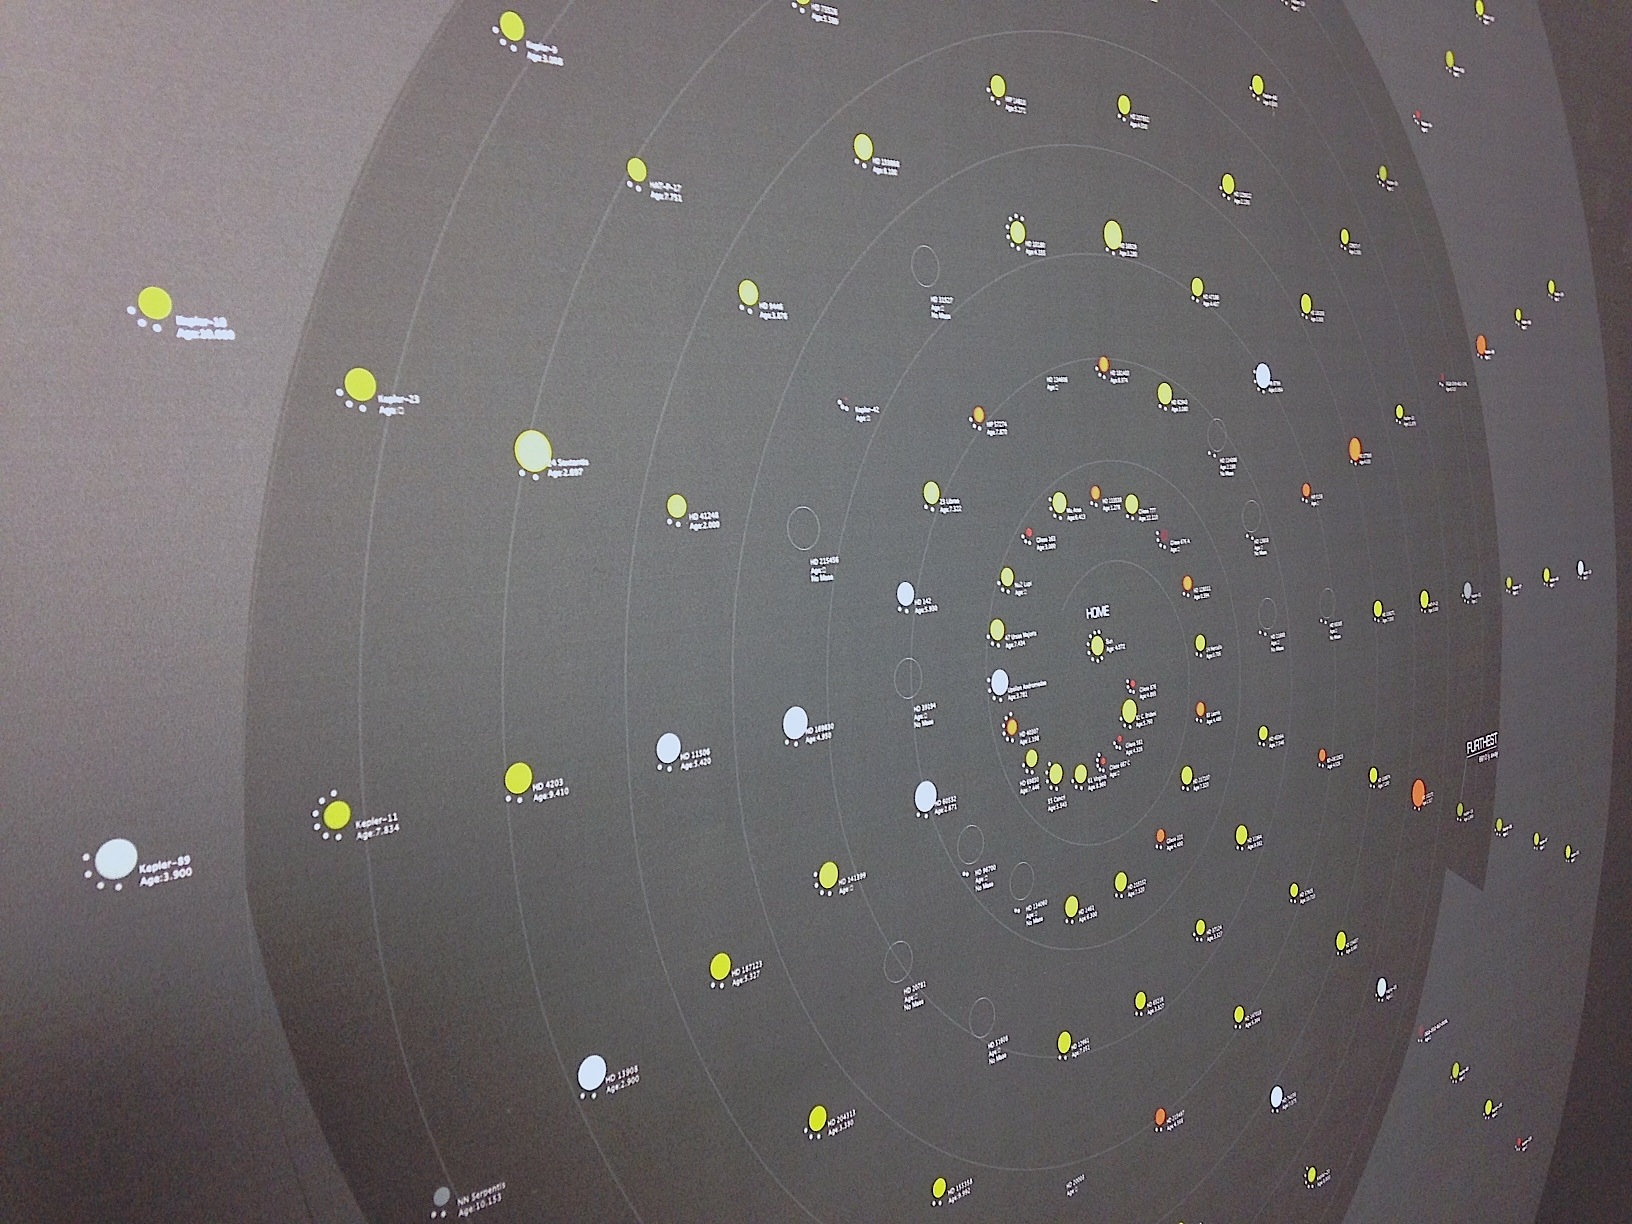
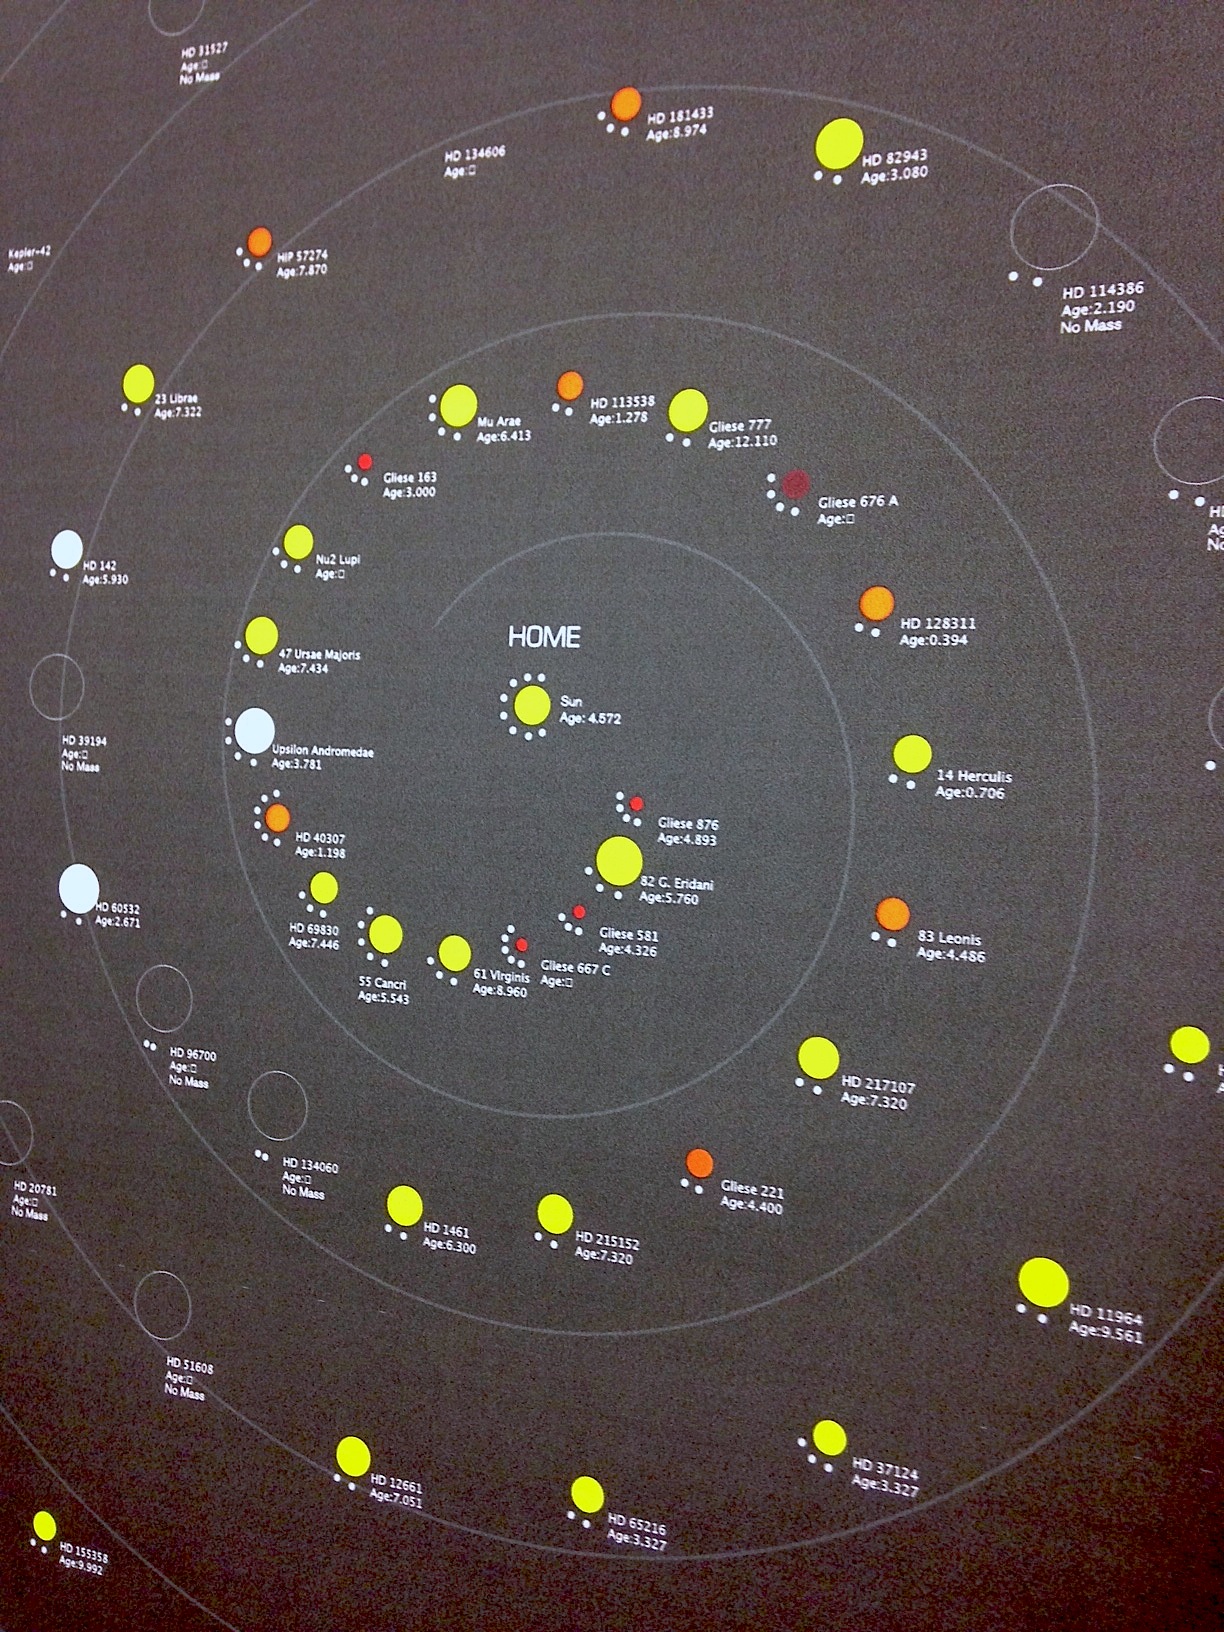
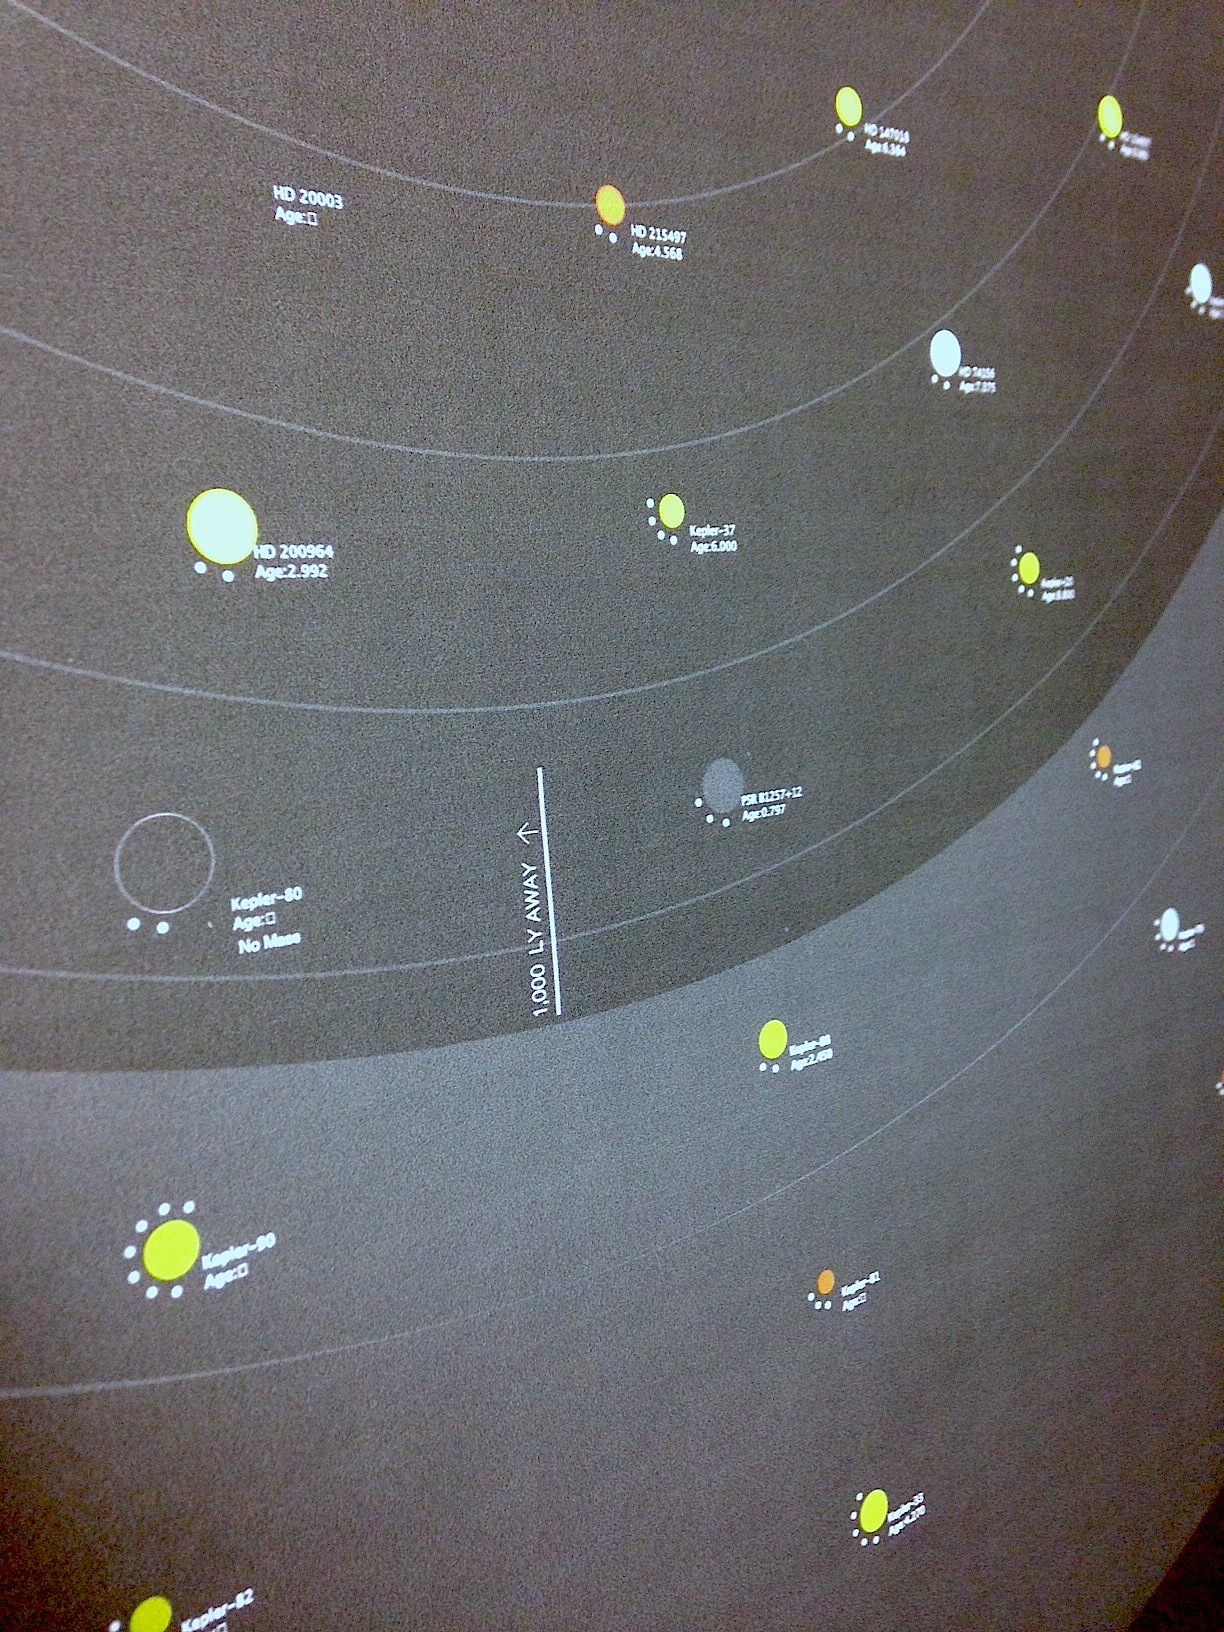
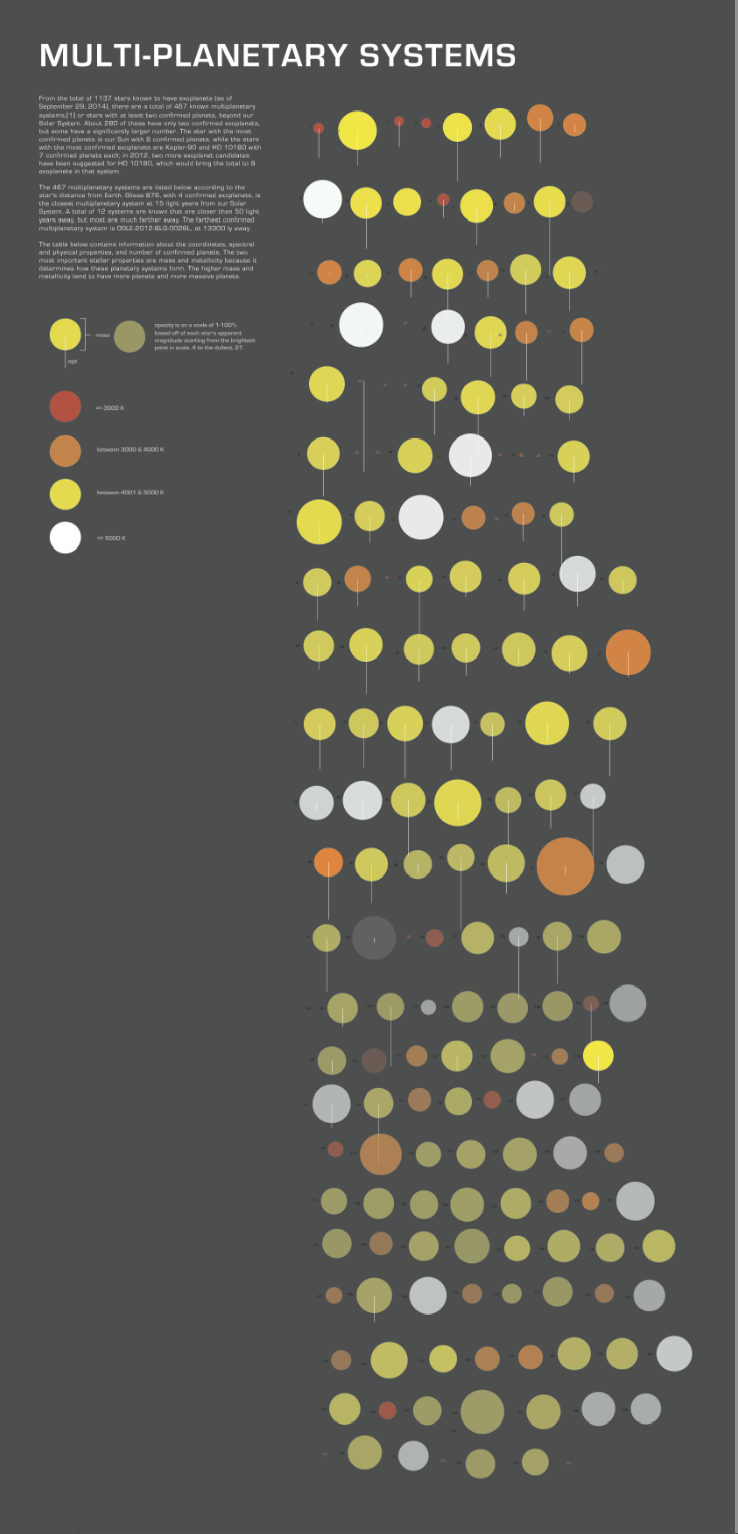
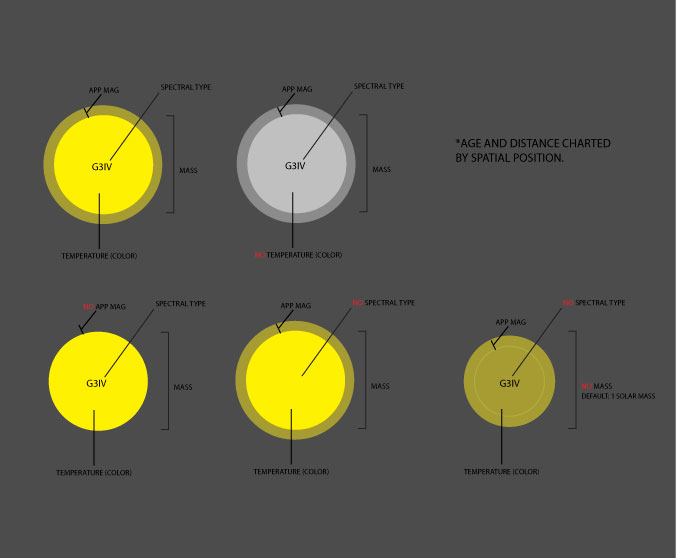
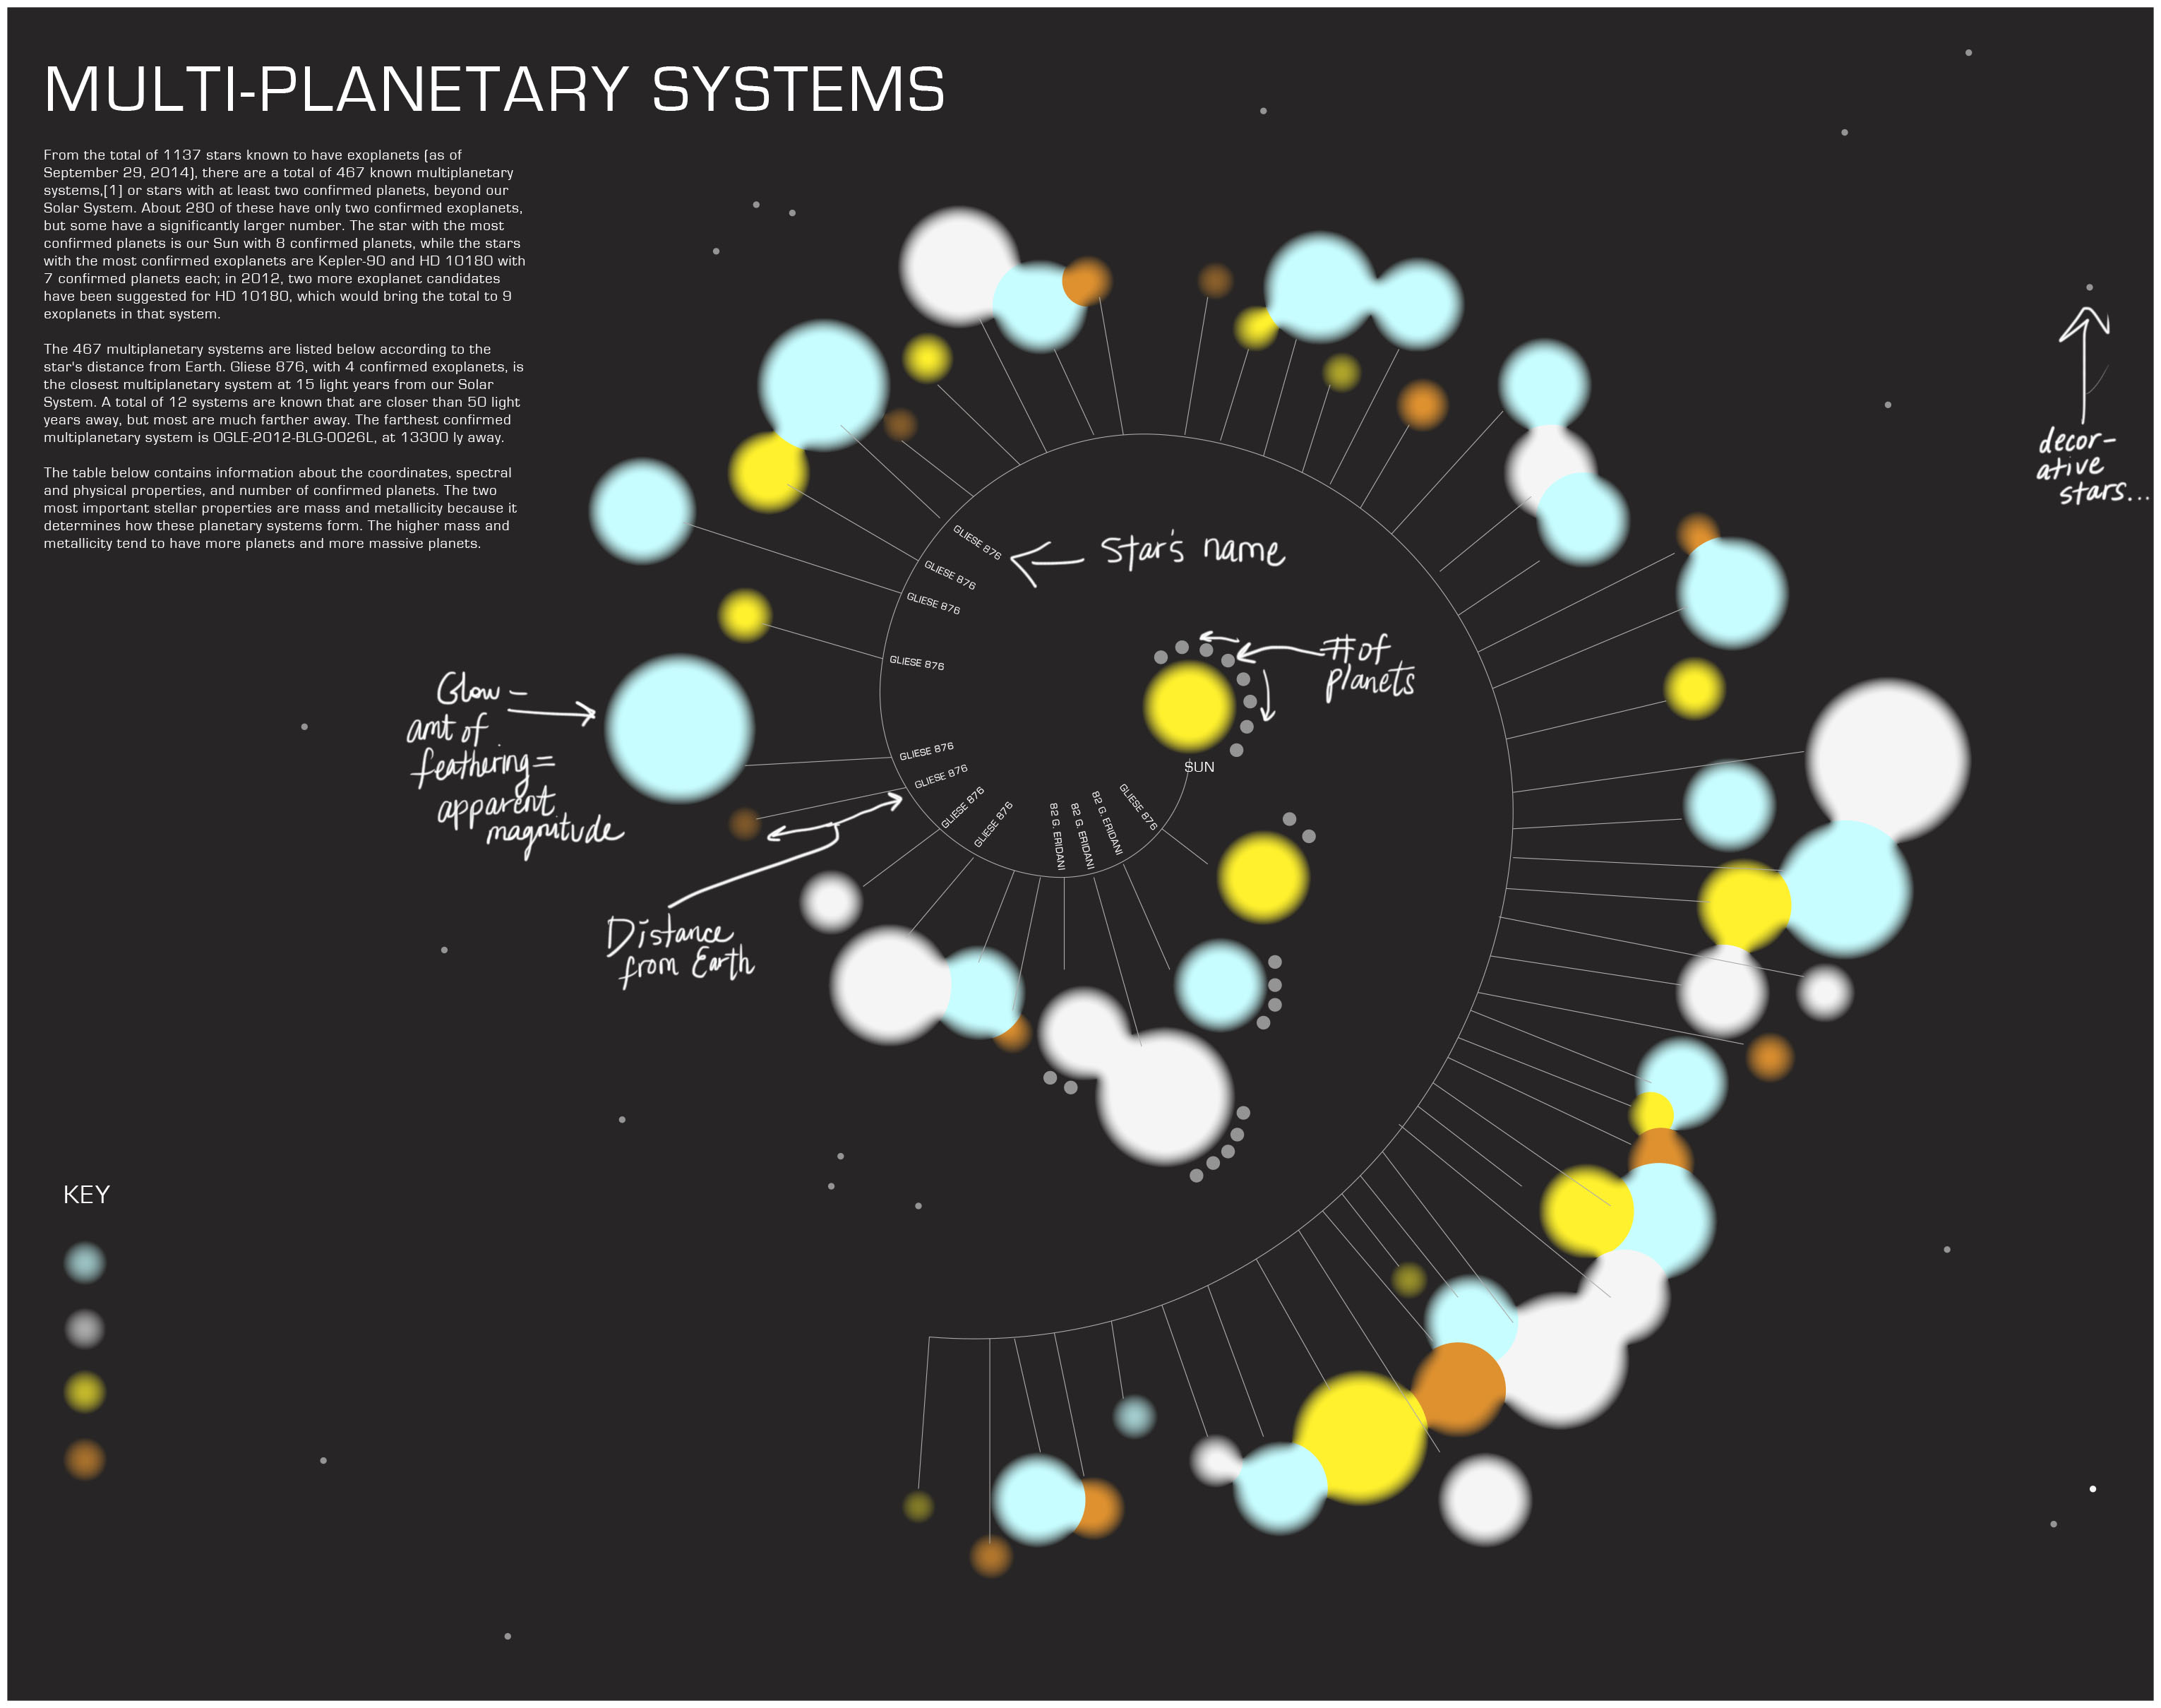
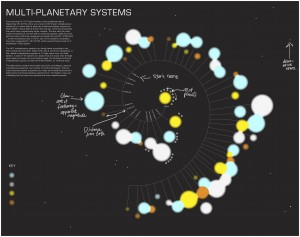
For my final Little Big Data, I created a spiral-esque visualization of the multiplanetary systems spotted by NASA’s spacecrafts, including the famous Kepler, up until 2014. Set in an Archimedean  spiral, the stars loop one after the other, the next further in distance than the previous. Many stars have no known distance and are set in a blocked out circle surrounding the spiral. Each star contains an orbit that holds how many planets it contains, along with individual information; its name, age, and mass. Stars with just an outline of the shape visualize stars with unknown mass. The color are in a range depending on their temperature; most saturated are the lower temps, brighter/whiter are the higher temps. The opacity of the stars shows how bright they are to the human eye, or their apparent magnitude. In the center of the spiral is our own Sun which you can then compare and gain an understanding of the other stars, possible locations where other planets like Earth might exist.

My attempts were strongly focused on getting a more logistical spiral to have each star equidistant from one another to show a more apparent distance as the spiral lengthened. The Archimedean spiral is more symmetrical and neat but loses the look of a spiral and adopts a starburst looking shape (not what I’m intending at all). Asides from that and smaller details, I’m somewhat satisfied with the final look. I hope, if/when I go back to it, I’ll point out more features, include information on outstanding stars, systems more similar than others to the Sun or other valuable information worth mentioning.

The combination of Processing and Illustrator was a really strong tool to use for me. I don’t think I’ll ever do a data vis manually ever again. What Processing did was make the process a lot simpler to manage, especially when including tiny information and playing around with all the stars’ positions. It also projected the size of each star, the orbiting planets all equidistant from the star. What worked in Illustrator was the type treatment, smaller navigation, the key, and the blocked out “distance unknown” circle shape.

The easiest thing to do was create the stars by pulling the radius as the mass values in my .csv table. The hardest thing to do was get the spiral working the way I wanted it to (hasn’t really happened yet). It’d be really interesting to also play with the distance more and play with the vast difference in space between the stars (15ly to hundreds of thousands of ly away).

Final Look

smallerstars

Photo shoot

photo 5

photo 1

photo 3

photo 2

photo 5

Discovery 2

For my next (and final) assignment, I plan to look at internet usage data in the US. The dataset I found dives into not mobile and internet users and questions their anonymity on the web. How much of your information do you think is online and how much of you do you mind being online? This is a recurring theme this semester so I’m looking forward to get some new insight on web usage and the privacy factor. Using 1,002 subjects, I am looking at answers as to how much information of theirs they think is online, do they block their information, use fake information, post information (on social networks) and see what actions contradict their beliefs or other behaviors. There is a lot of information to filter through but it is all in a CSV file; lots to delete…I am mostly interested in their perception of anonymity versus their online behavior regarding personal input.

Ideas for visualization:
thedraft1

draft
thedraft2

draft2

Little Big Data: Progress

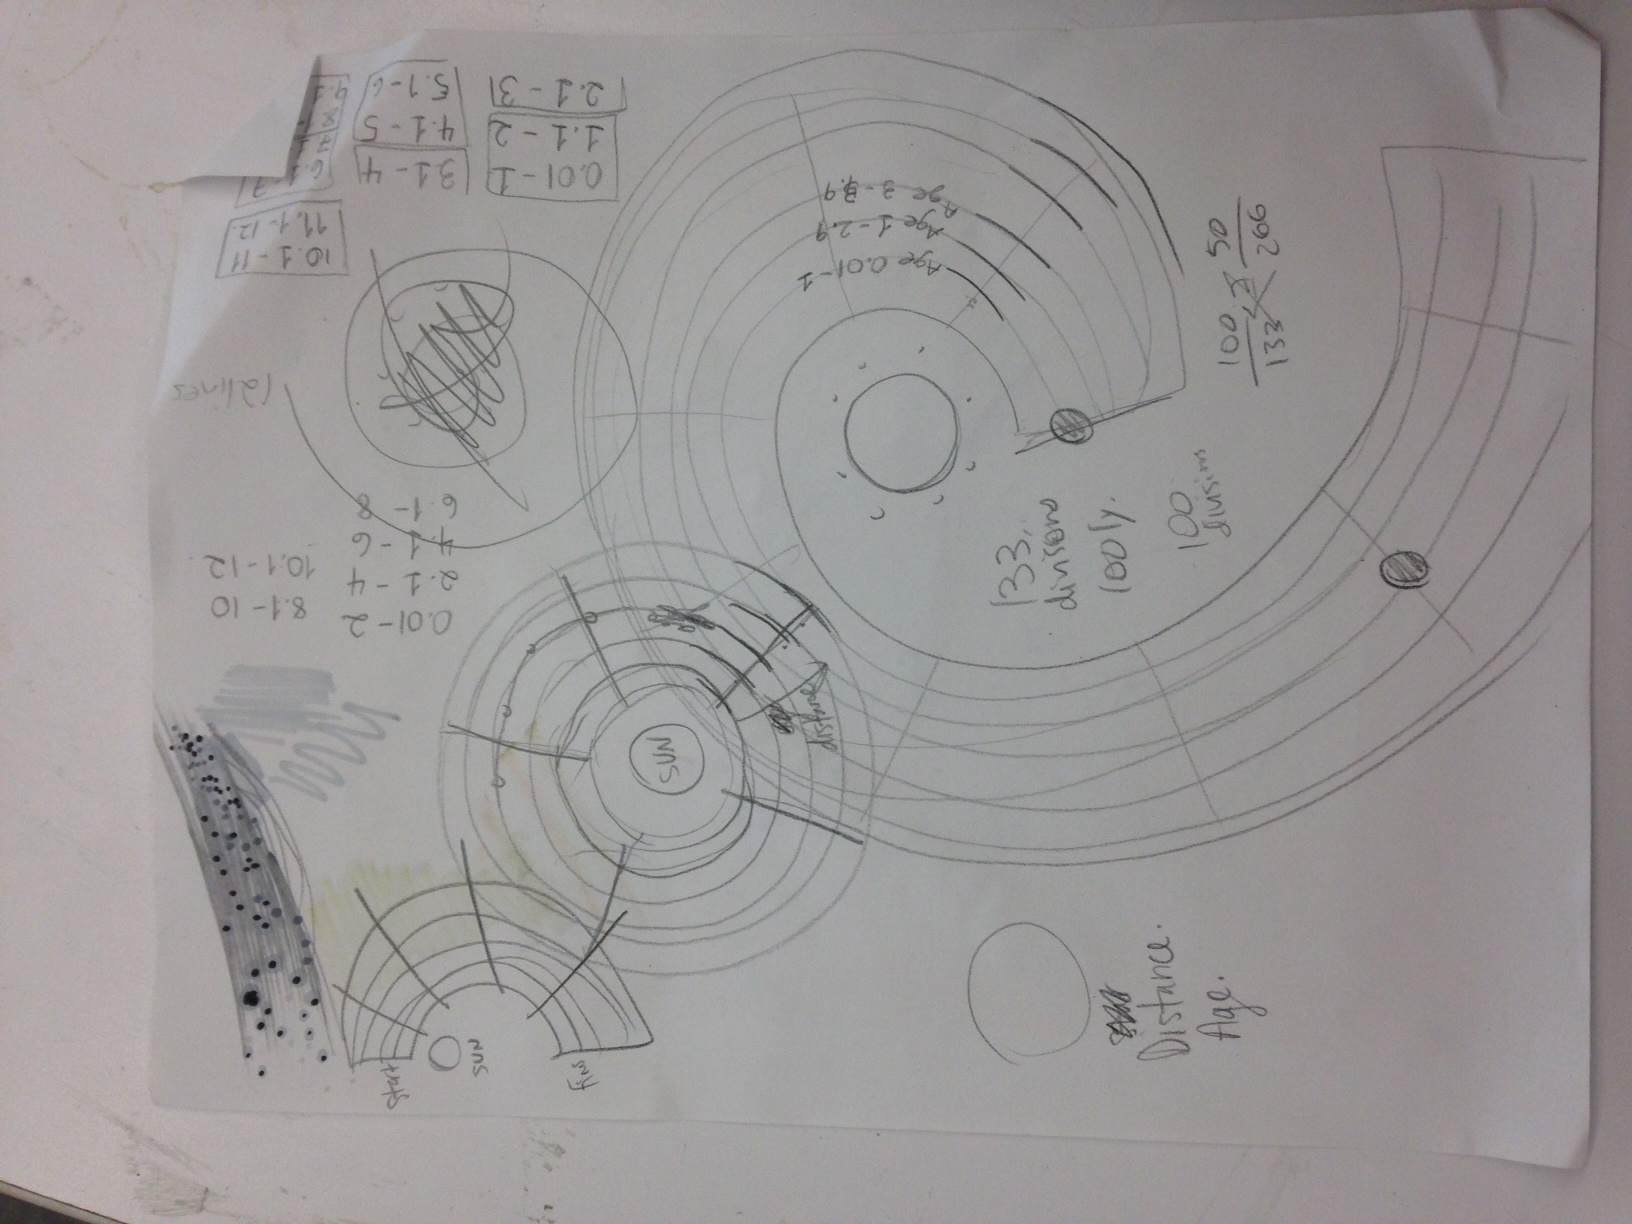
This week I was able to organize my stars (ellipses) by distance order in Illustrator in a clean fashion.  My code was able to compute the stars’ temperature (by color), apparent magnitude (opacity), and mass (size). My last remaining values are distance and age. Originally, distance was going to be measured by placement on a spiral, starting closest to the sun and age was going to be measured by each star’s proximity to the spiral (on the spiral = very young; far away = very old) connecting each star by a line attached to the spiral. However, the variating ages interfere with the actual space that the beginning of the spiral offers and quickly creates a messy look (it was kind of anticipated). Now I’m working on sketches that could make this spiral idea work out but in a  form that allows a consistent look despite the varying values.

Here’s my illustratorfile so far.

Screen Shot 2014-10-20 at 5.48.55 PM

Here is a sketch of a possible new spiral.
photo(4)

Proofs of Concepts

This is my list of Proofs of Concepts:
1. Can I get my data file into Processing?
2. Can I make ellipses show up by size order and by distance?
3. Can I fit all these planets in one cohesive space?
4. What size do the stars have to be to fit onto a screen and be readable? (mass to screen pixels ratio)
5. What do my “unknown” rows look like?

Can I get my data file into Processing?
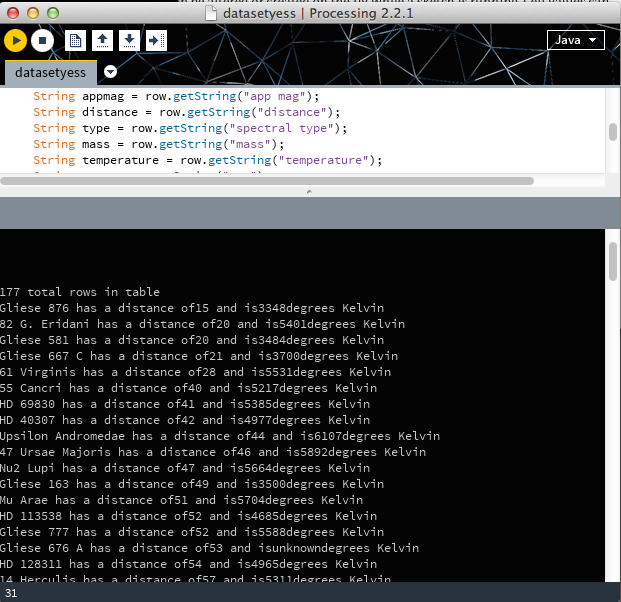
1. Yes! I can! And here’s a print line to prove it!

Screen Shot 2014-10-13 at 4.30.14 PM

 Can I make ellipses show up by size order and by distance?
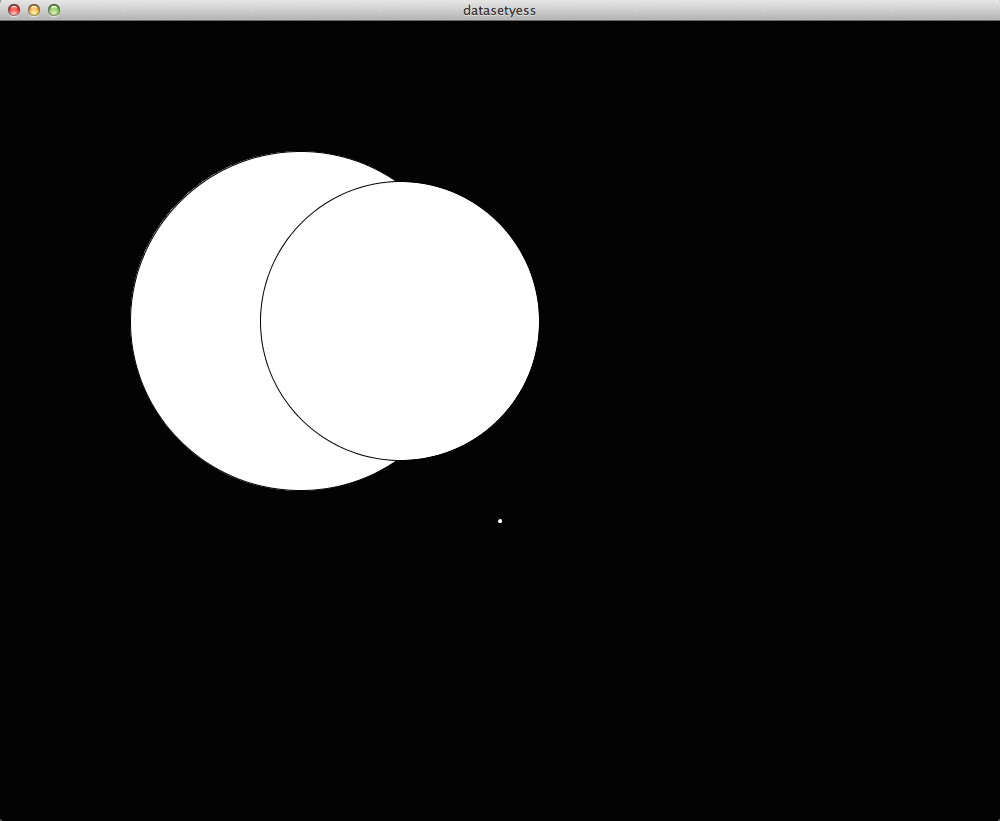
2. Kind of. This answers #4 too. The ratio is 1:180 in relation to solar mass which starts at 1. These ellipses show largest, second largest, and smallest units (3).  I know there is a way to make them all show up through row call but I haven’t been able to get the syntax right.
Screen Shot 2014-10-13 at 5.14.13 PM

Can I fit all these planets in one cohesive space?
3. I tediously got all of them in one space on the page. It doesn’t look cohesive at all but now I know that size isn’t exactly a big issue.

Screen Shot 2014-10-13 at 5.47.43 PM

What size do the stars have to be to fit onto a screen and be readable? (mass to screen pixels ratio)
4. Answered in #2.

What do my “unknown” rows look like?
5. Quick sketch of possible looks for each piece of information missing.

starlook

I plan to use both Processing and Illustrator for this assignment. Processing: just to gather all my shapes, sizes, and position closest to furthest/Illustrator: to include type, “star” design, and positioning through spiral form.

Almost forgot!
My POC folder

Little Big Data Discovery

My Research
For my Little Big Data, I did A LOT of research. The majority of what I was interested in, I found too little data (too specific or inaccurate search) or way too much data (too many meteorites, too many earthquakes, etc).

Success?
The most interesting data set I found was the Candidate Planets  that were discovered using the Kepler spacecraft.  However, the confirmed planet list contained 7,000+ planets (I’m still thinking about it, though). A more fitting set of information I found was a list of multi-planetary systems, most of which were discovered using Kepler. I am a little iffy because my information comes from…wikipedia. But, I did a few verifications with the Exoplanet Archive, a related source that pulls from Nasa, and confirmed that Wikipedia used the same information for each subject. Why can’t I use the Exoplanet Archive? Because they sort their data by planet and individual object pages instead of solar system list.

What I am Looking At and WHY
The table of information I am looking at contains
1. The star’s name
2. The constellation it lives in
3. Its apparent magnitude (how bright it looks to the human eye)
4. Its distance (in ly)
5. Spectral Type (what phase of star it’s in)
6. Solar Mass
7. Temperature (in Kelvin)
8. Age
9. How many planets orbit it

The reason I am interested in the Kepler multiplanetary systems is because it is a showing not only a huge step in the field of space exploration and discovery but is also allowing us to see what has been in front of us this whole time, several solar systems that might or might not have life on them. The planets are worth noting because they all have several characteristics that make them new-earth-worthy; why I am still  hooked on the Confirmed Planets list. It is still an interesting approach to look at the stars that have been established as possible new suns. How old are they? Which ones are closest to us?  Which look the closest to our sun, in age, spectral type, mass?

Here is the .xlsx_file

Here is an idea for my visualization:
littlebigsketch

BiggerLook


On a completely different strand of my brain
Here is the other_information I was looking at and its source. I got a clue that maybe more than 1,000 is okay but  It shows the names of all planet candidates considered by Nasa/Kepler. Along with them it shows their (in relation to Earth’s) mass, density. And their temperature, orbit period, eccentricity (shape of their orbit), inclination (tilt of their orbit), distance from Earth, their Star’s temperature, mass, radius, metallicity (ratio of iron to hydrogen), and apparent magnitude. I’m bouncing back and forth between these two ideas and I am torn between what is most important, what can be taken out.

What I have established 
I want a formal, futuristic look, using Eurostile typeface. The colors of my sketch are my palette as of now, unless I have to include more extreme, saturated yellows and oranges (for star types or planet differentiation).
 

Code Warmup P.II

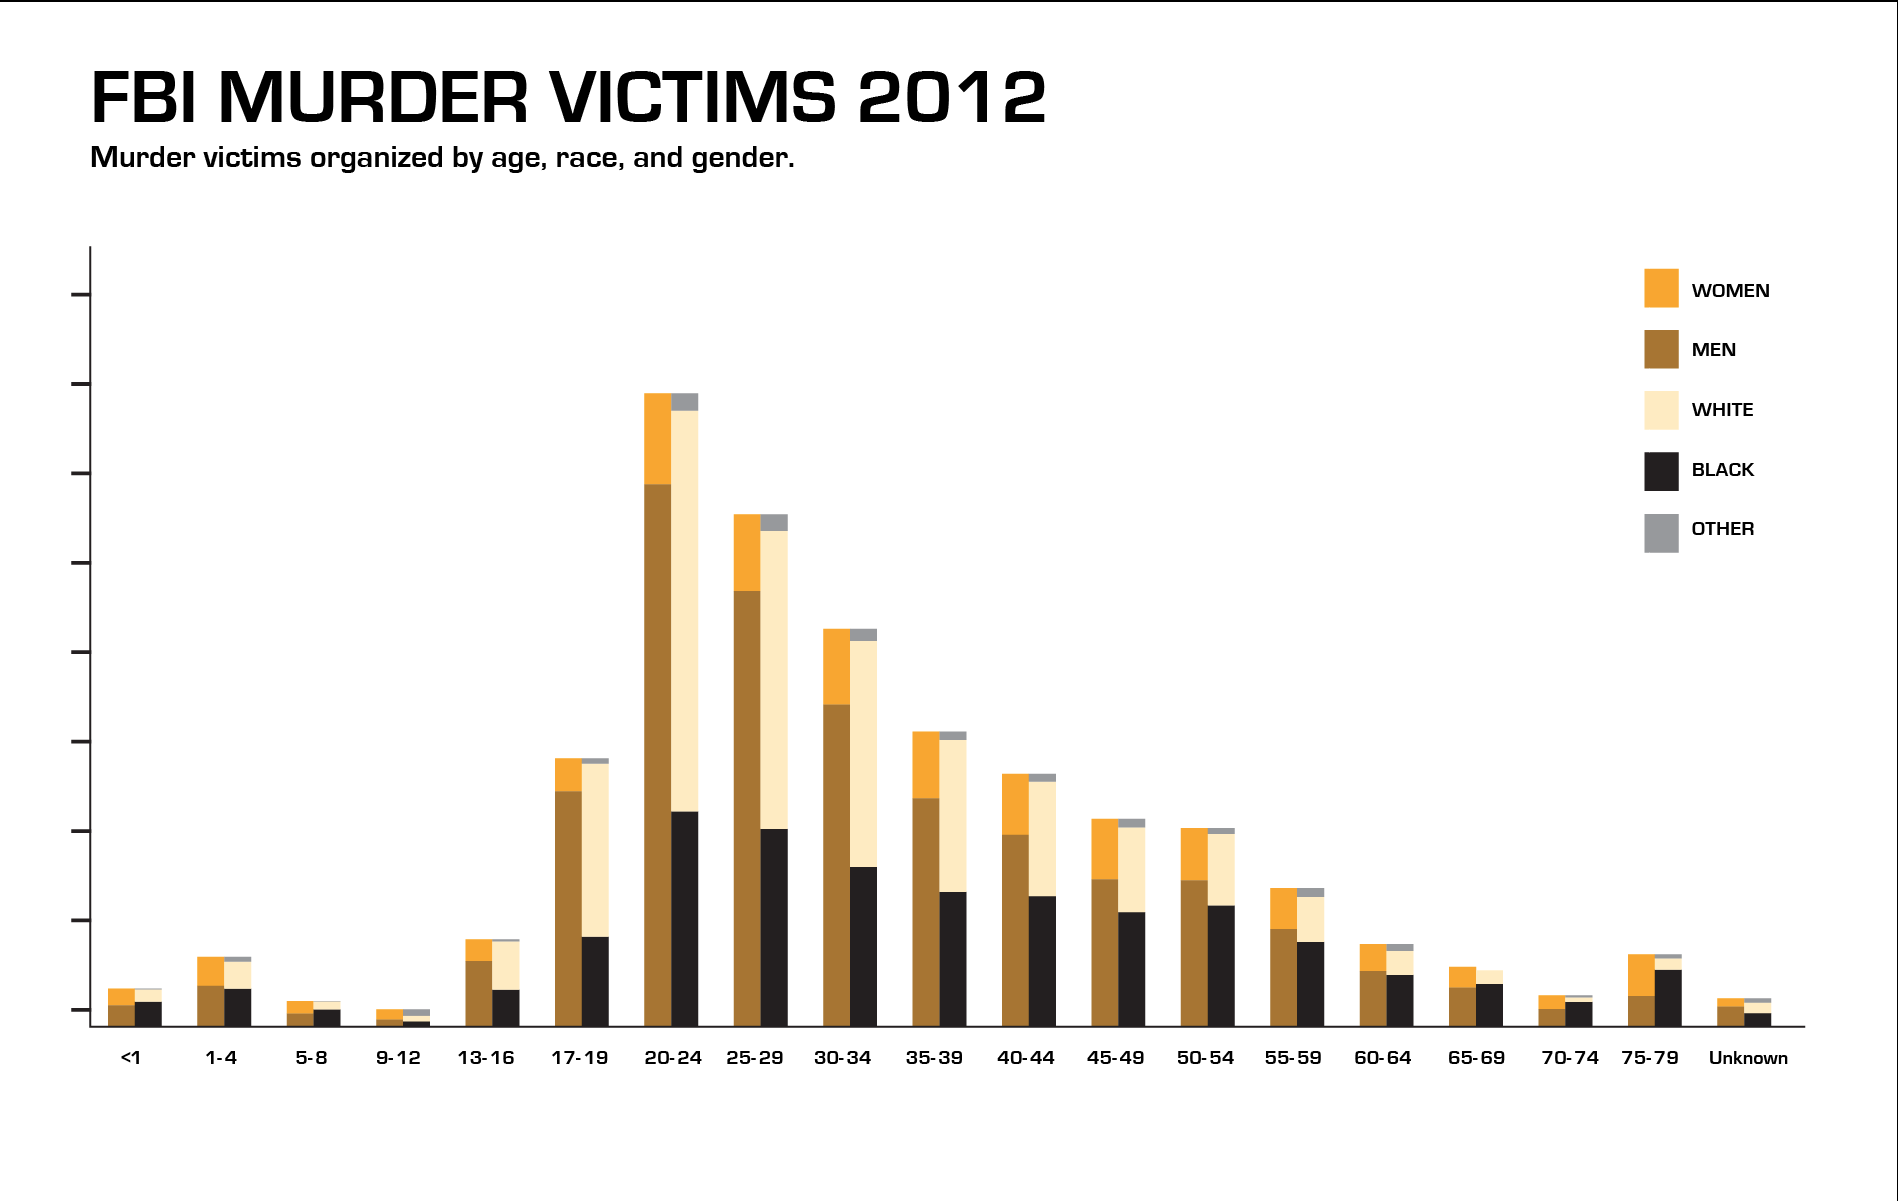
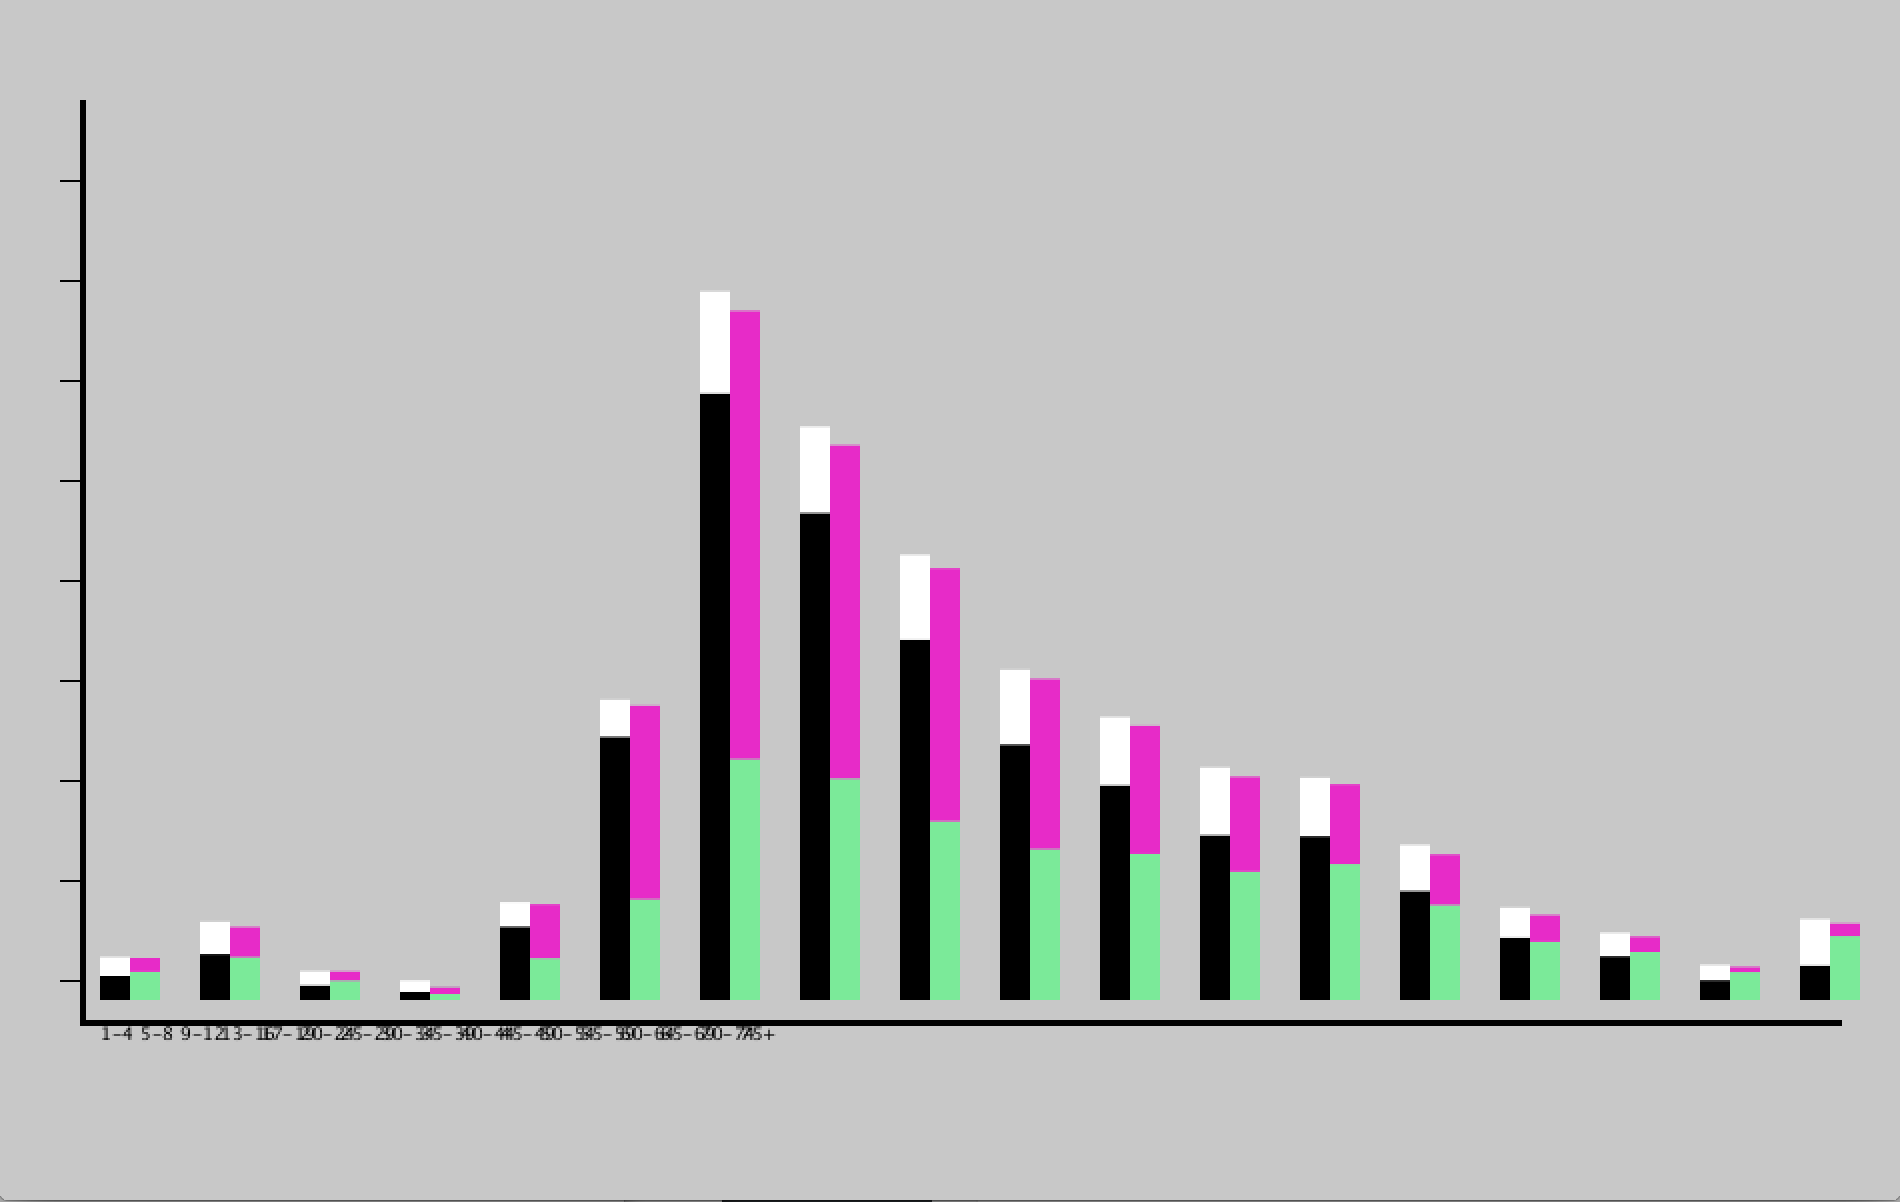
For my Code Warmup Part 2, I chose data I found in the FBI database. One thing I am interested in, among many, is crime and the justice system so I took a look at one of the several data charts the FBI website contains. I looked at murder victims in 2012 by age, gender, and race. Age was most interesting to me and can be easily seen through a bar graph rendering. I decided to try the stacked bar code to figure out how much I can add/alter to the stacked bars. It was going well until I tried adding an additional set of information to my float array ([][][]) but it took forever and never worked out. I cheated by adding my additional information to ‘race’ as a last stacked bar using illustrator, just by aligning to the ‘gender’ bar stack to add up to the total population.

It was interesting using Illustrator with Processing because Processing did the “easy” work of inserting data and spitting out the image while Illustrator does what it does best and let me design the data 1-2-3. While I thought that time would be on my side for this assignment, given the easier way of doing things, code still takes up most of it–always trying to figure out what the hell went wrong…over and over again. I would like to know exactly how you can add more bars to the stack for future more complex sets of data.

Source

fbidata

Screen Shot 2014-09-29 at 5.53.29 PM

Finished result


How it looks in Processing (pre design)

Screen Shot 2014-09-29 at 5.55.35 PM

Code

Code Warmup

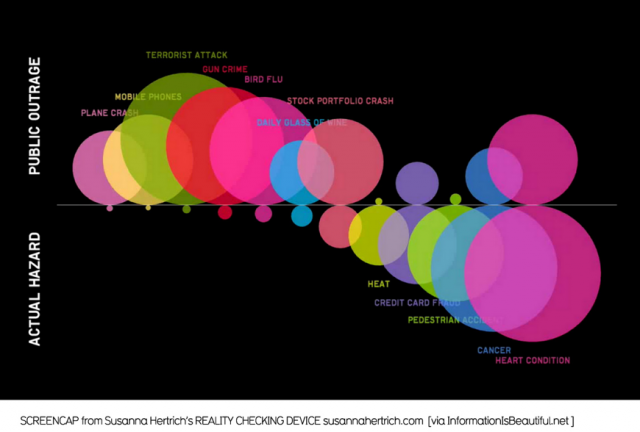
For my code warmup, I chose a pretty simple visualization that showed the comparison of public outrage against life risks versus the actual hazard of each risk. Here is the original image:

Picture-2-640x432

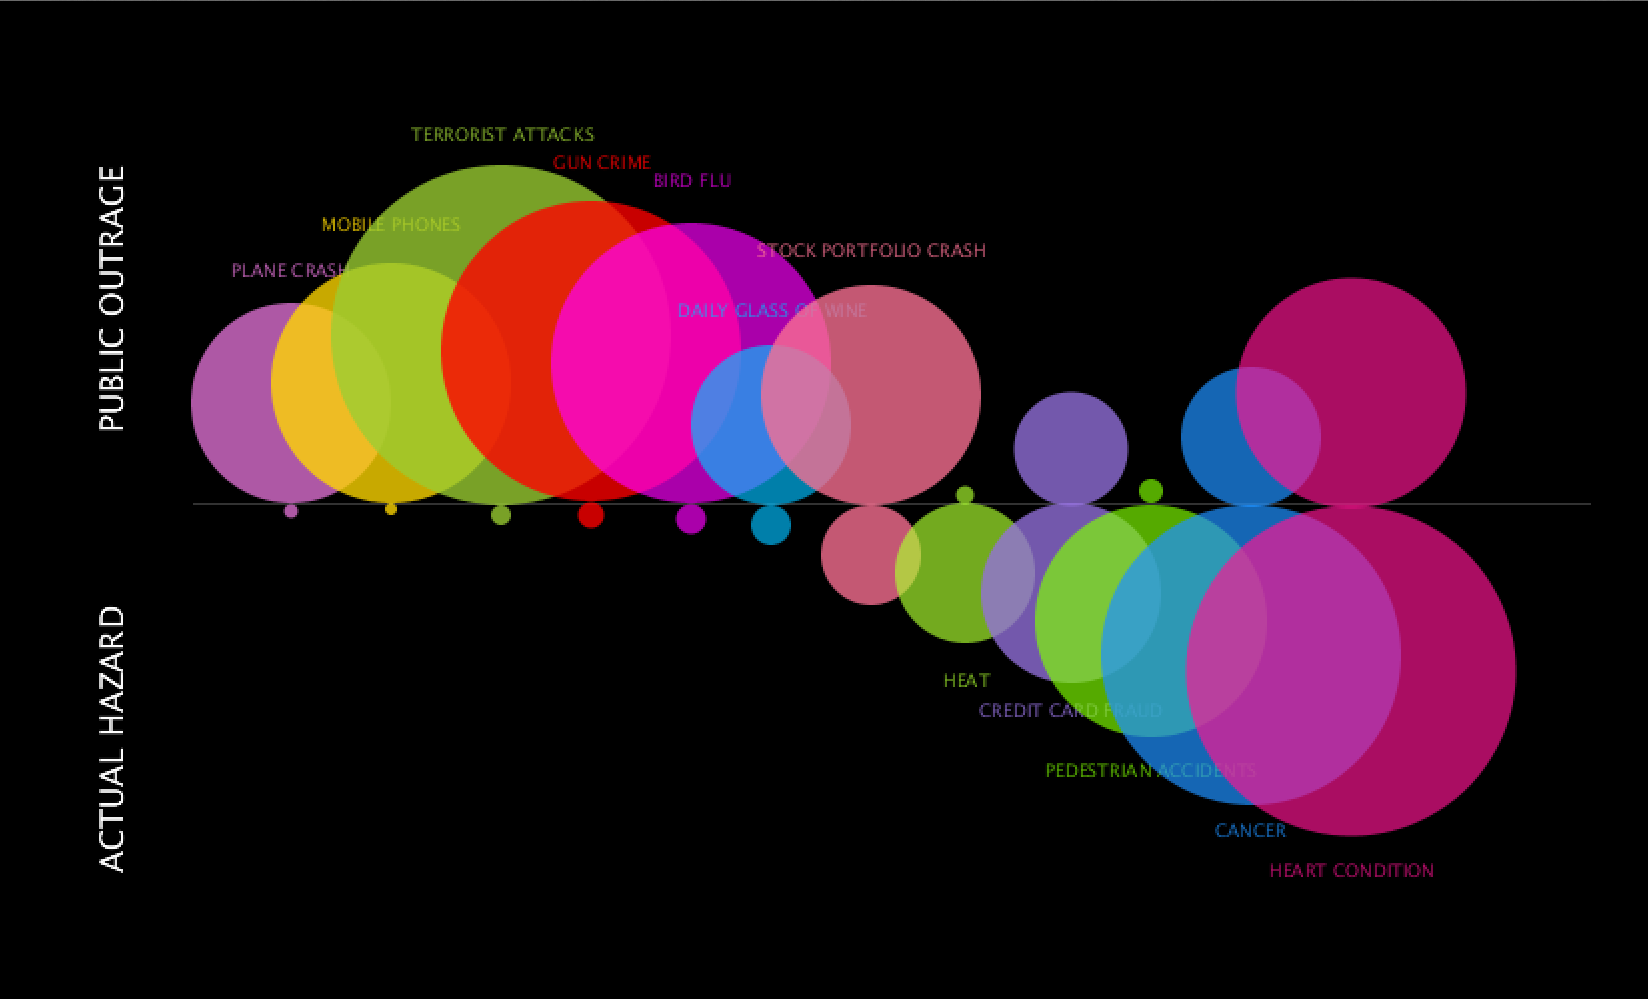
Here is the Processing copy:

Screen Shot 2014-09-22 at 3.11.15 PM


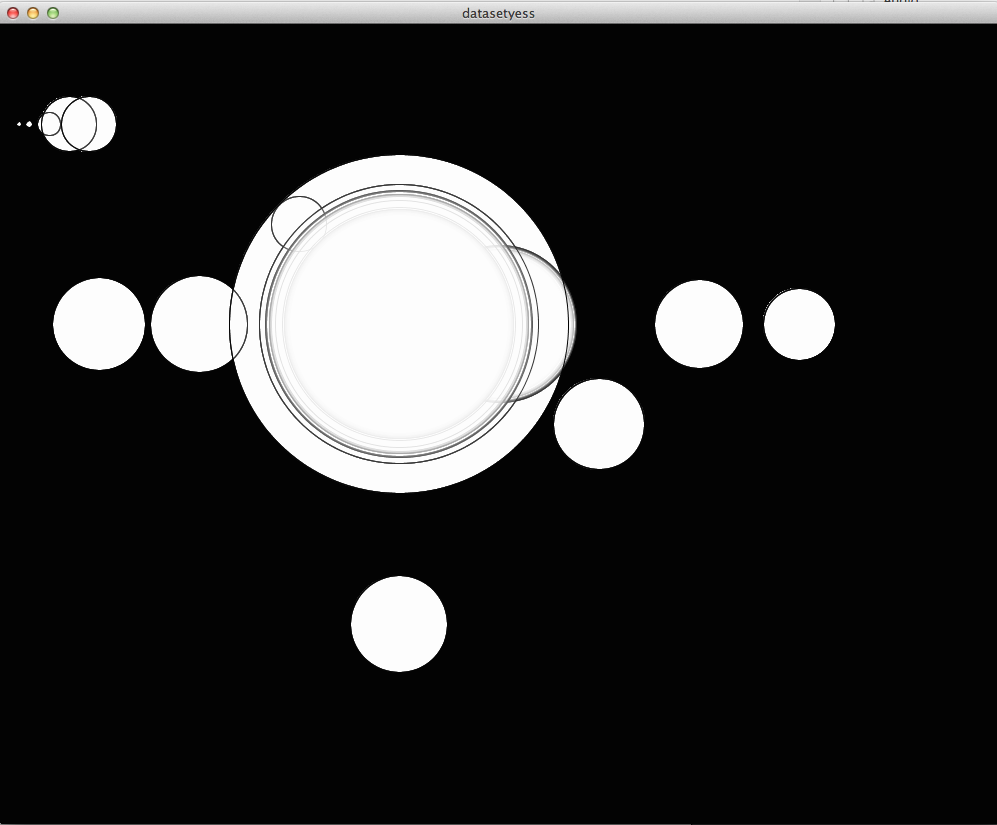
Surprisingly, most of the work was recall of past Processing experience.  It was tedious finding exact coordinates and I know there is a way to drag the screen for the coordinates but could not figure that out. Asides from that, the ellipses were just trial and error and eyeballing (and more math than usual in my daily life) to figure out size and placement.

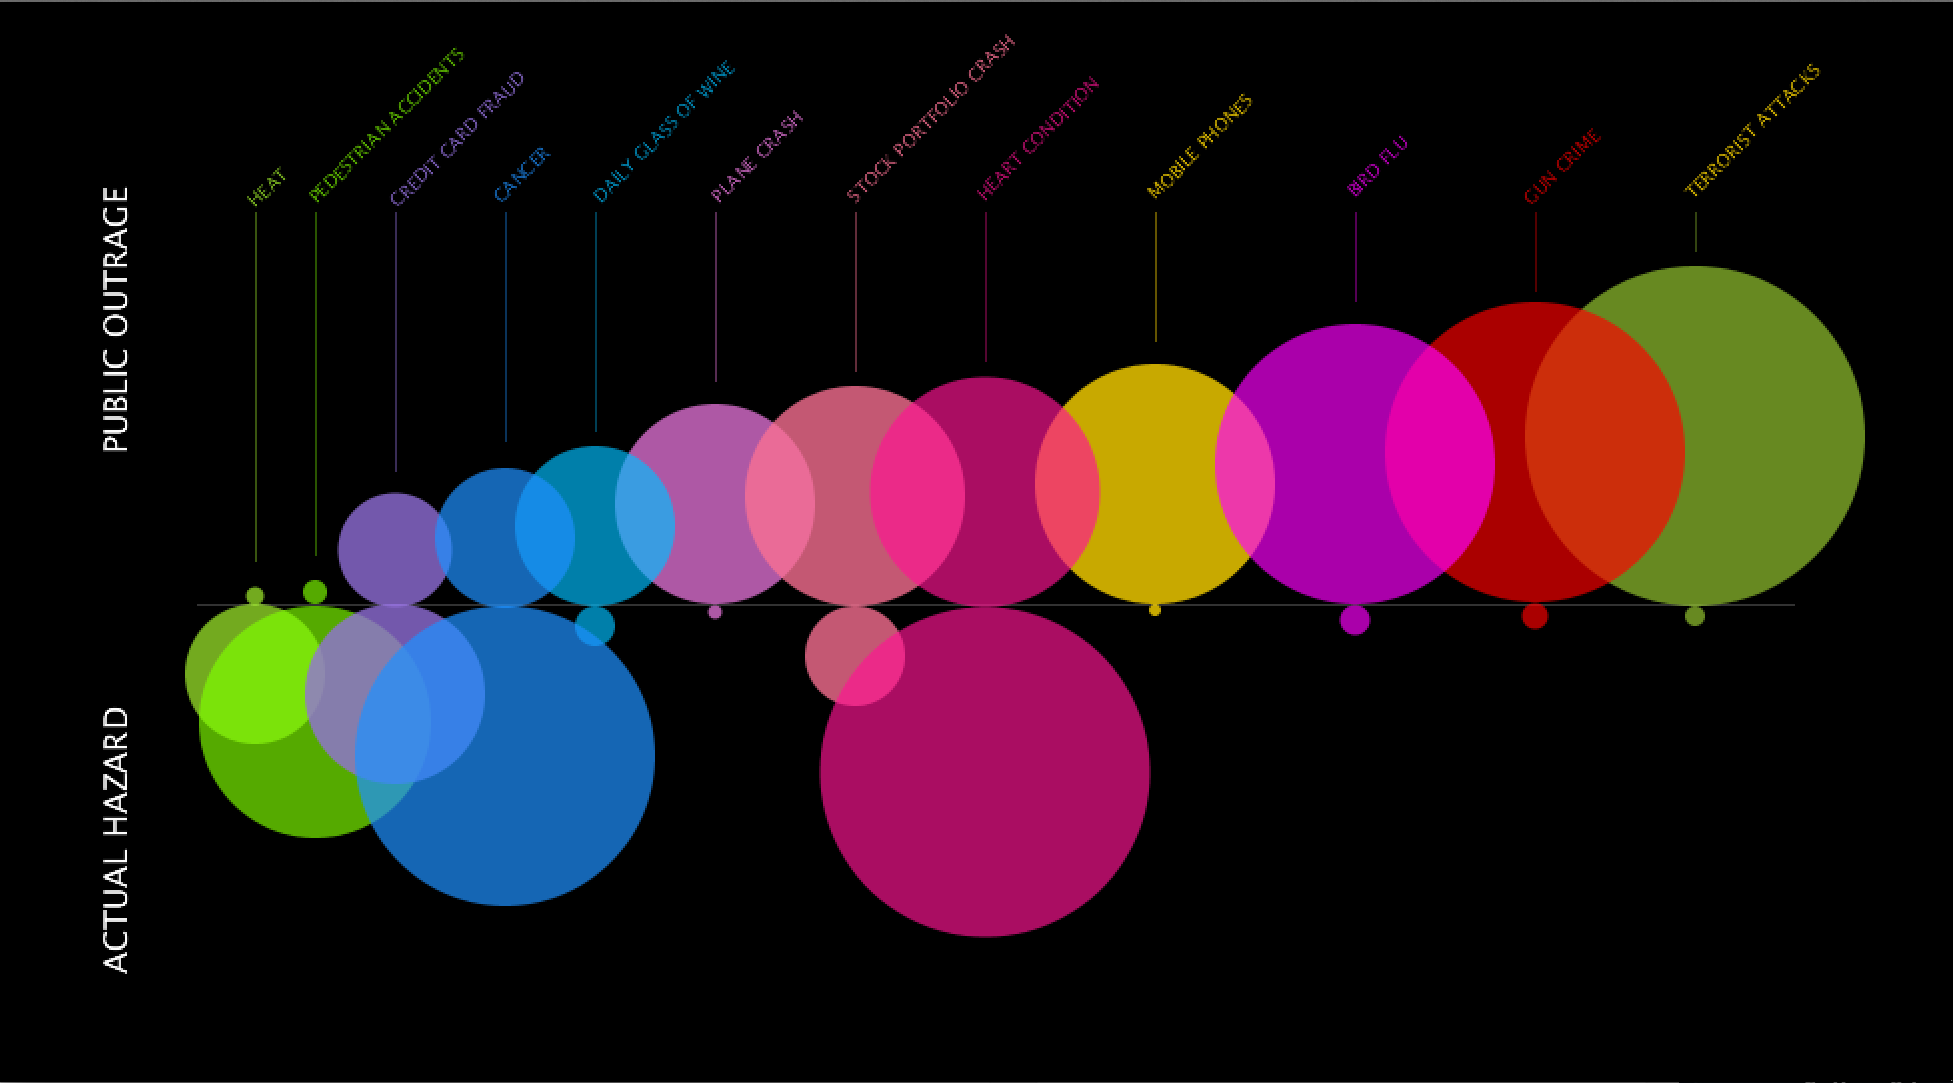
It was a lot more interesting to figure out the next assignment. I decided to make over the same visualization because although it has interesting information, I was curious to see it organized differently. The original layout shows from smallest to biggest actual hazards and their public outrage counterparts. Taking a look at the information is interesting in itself but overall, it felt like both public outrage and actual hazard were competing for attention with the largest bubbles for either side focused on left and right. I wanted to flip it and see the results for smallest to biggest for public outrage. I did a quick sketch in Illustrator and realized that I, myself, read the information more clearly in this layout. Somehow there was cohesion by focusing primarily on the growth of outrage and realizing a bigger negative space for actual hazard. There is more contrast for one side that helps you focus on the other and then make the comparison. Lastly, I structured the titles for each bubble to be above and connected with a hanging line. It was a pain to figure out rotated text, but rationalizing comes a long way in code and sometimes things just came in place which made the process a lot more fun.  This is the redo:


Screen Shot 2014-09-22 at 5.07.07 PM

Code