http://www.therefugeeproject.org/#/2012
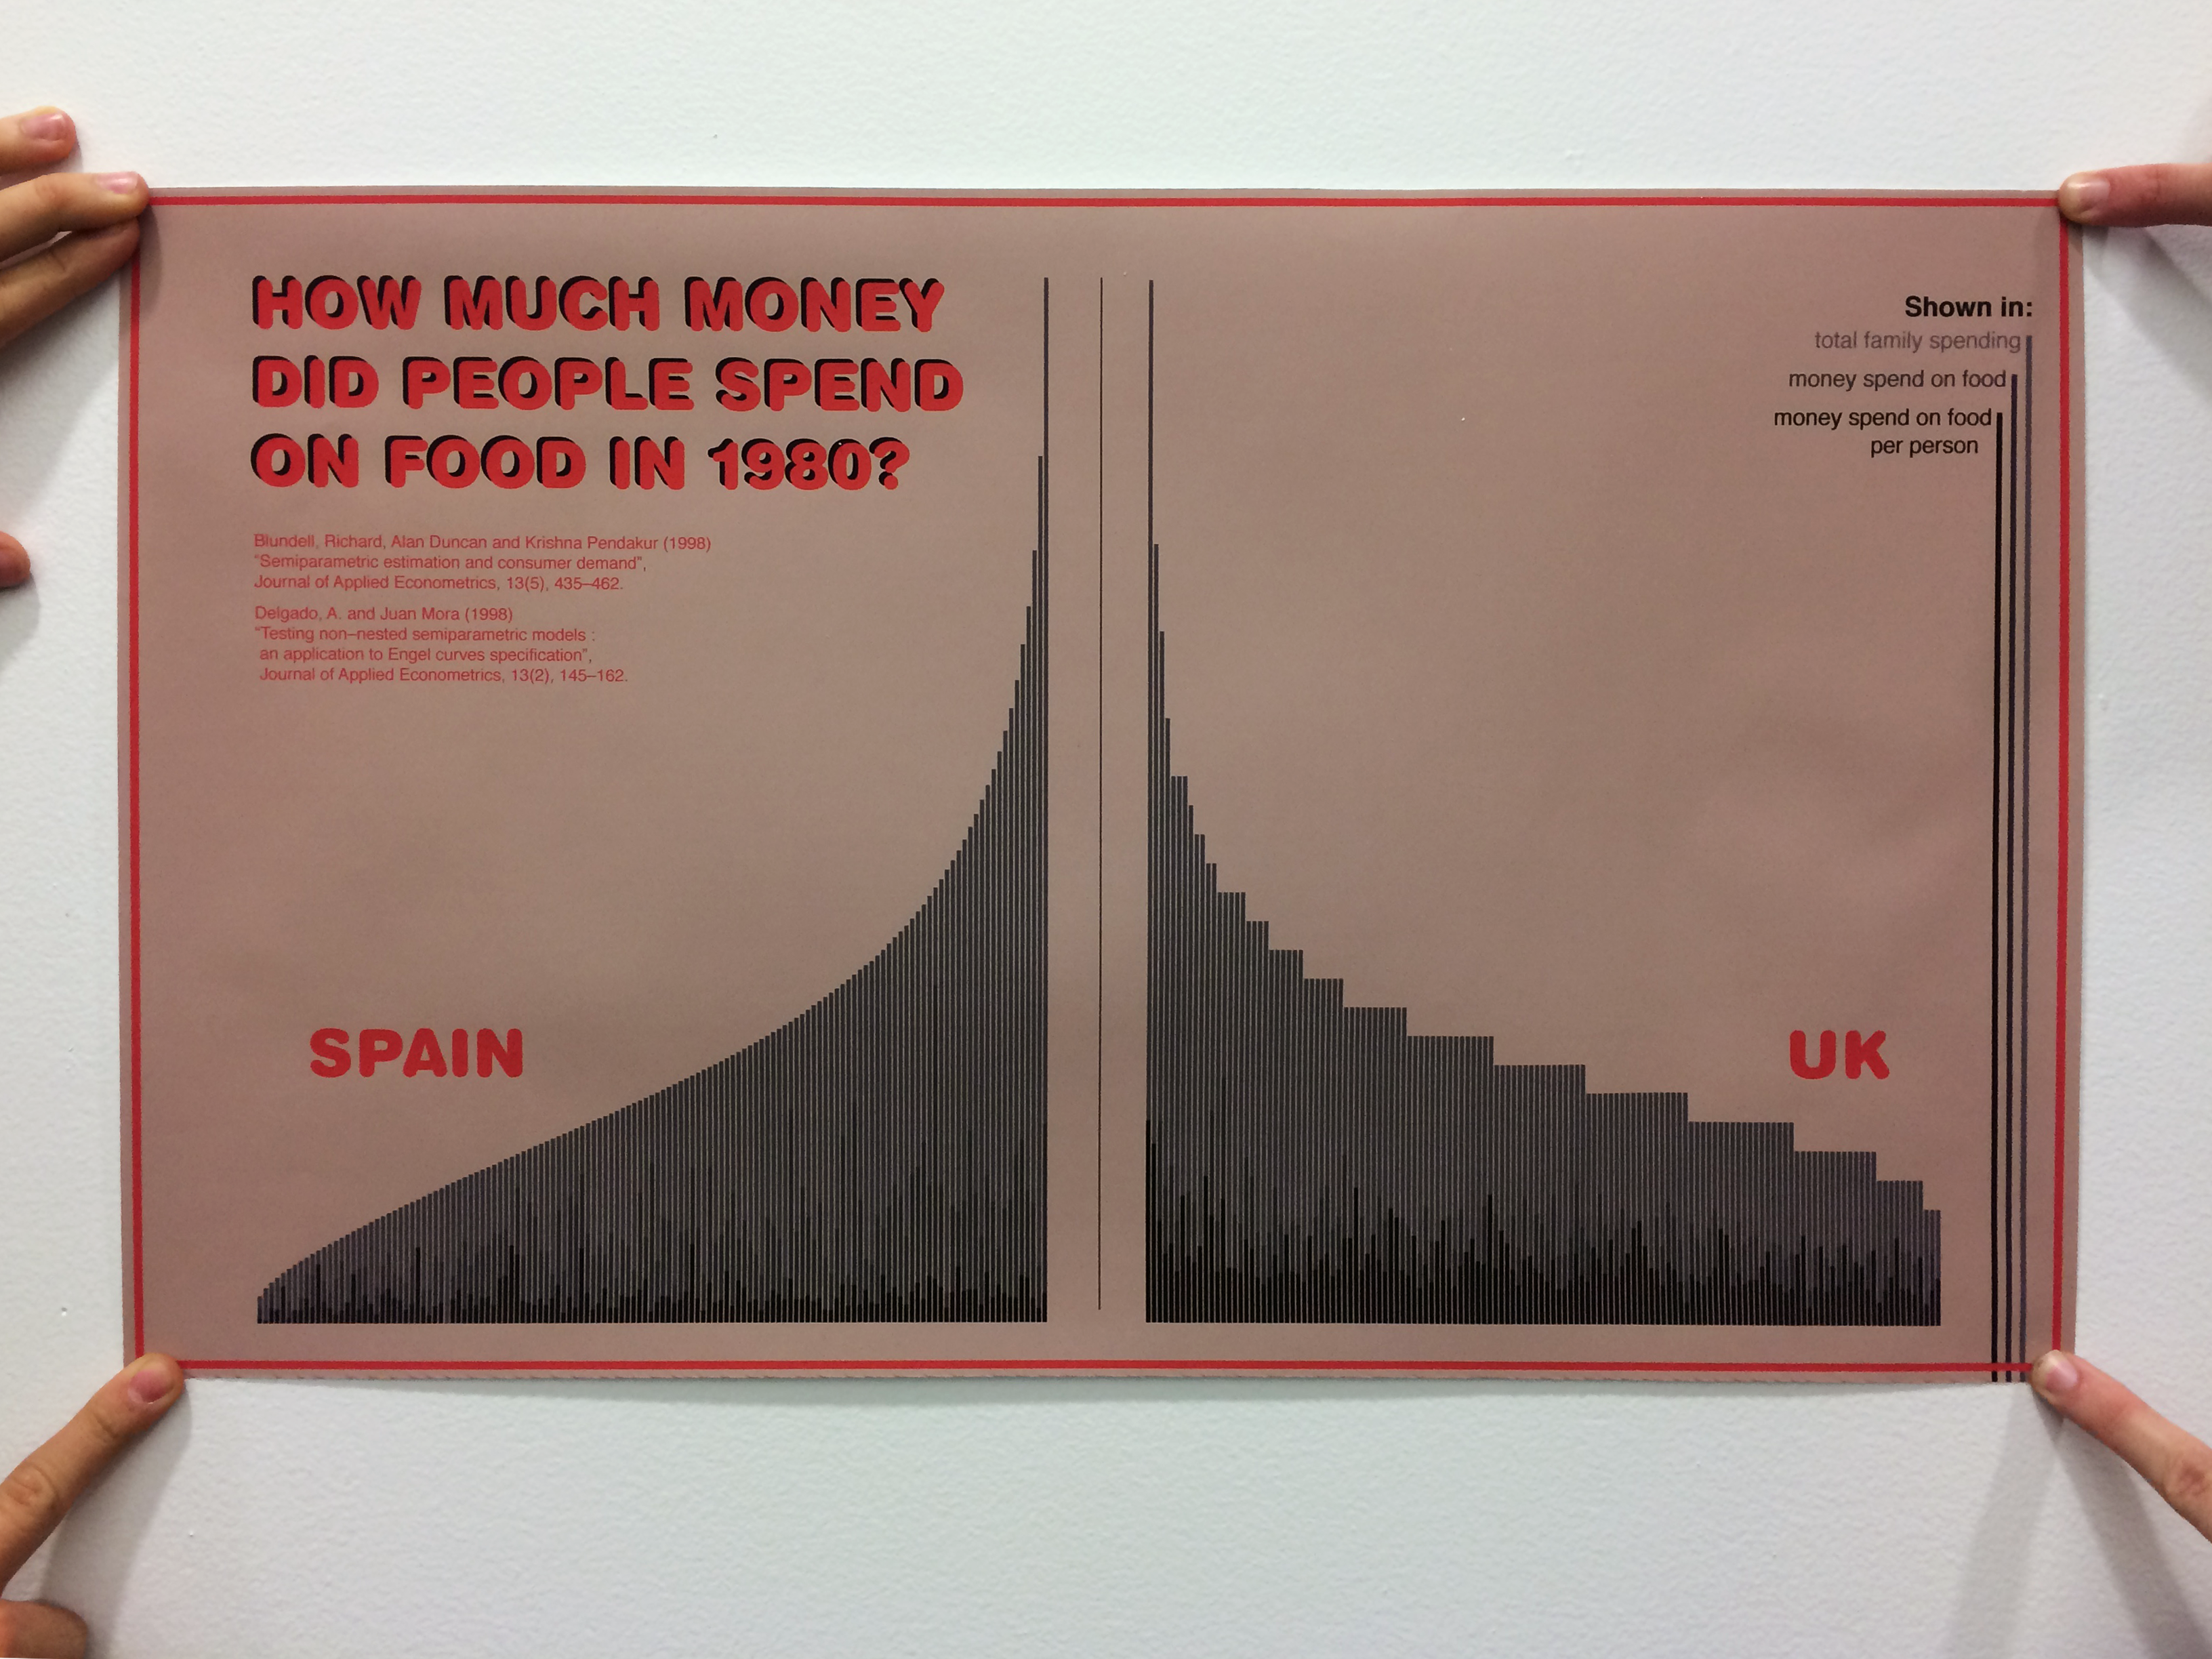
In this assignment the task was to make a data visualization that should at least have 1000 pieces of data. The data I used are showing the amount of money people did spend on food in relation to their income in the UK and in Spain. The poster gives an overview of the cultural differences between the two countries. I used .csv formatted data and handled it with processing and illustrator.
I basiclly just wanted to see if I can upload the .csv into processing, which didn´t work for some reason. This is the error:
“Error reading table on line 0”
This is the code:
import processing.pdf.*;
void setup() {
size(600, 400);
}
void draw() {
background(255);
// load all fonts
String[] fontList = PFont.list();
//PFont myFont = createFont(“Futura-CondensedMedium”, 32);
// textFont(myFont);
//textMode(MODEL);
Table budgetItaly = loadTable(“BudgetItaly.csv”, “header”);
// loop through the data
for (TableRow row : budgetItaly.rows()) {
// grab each column
int number = row.getInt(“number”);
float percentage = row.getFloat(“wfood”);
int total = row.getInt(“totexp”);
int age = row.getInt(“age”);
int size = row.getInt(“size”);
int town = row.getInt(“town”);
String sex = row.getString(“sex”);
// filter bad data
// if (name == “”) continue;
plotList(number, percentage, total, age, size, town, sex);
}
}
void plotList(int number, float percentage, int total, int age, int size, int town, String sex) {
println(number,percentage,total,age,size,town,sex);
}
The subject
The poster will be about. how much money people send on food. Right now I plan 3 posters comparing 3 different countries. I´m mostly interested in culturewise differences, but also age-based things will be interessting, as well as the size of the family.
I hope to find out how the money is spend in different ages of live. Do old people spend more or less? How about families?
The data
The data are 3 lists, each about 23.000×7 data pieces. It involes the size of the family, the sex and the size of the town they live in, but I plan to not use most of the information. The data is coming from this journal: “Delgado, A. and Juan Mora (1998) “Testing non–nested semiparametric models : an application to Engel curves specification”, Journal of Applied Econometrics, 13(2), 145–162.” and was made in spain.
The tools
I will use processing to get the data into shapes and will than go on in illustrator to layout the design.
The comp
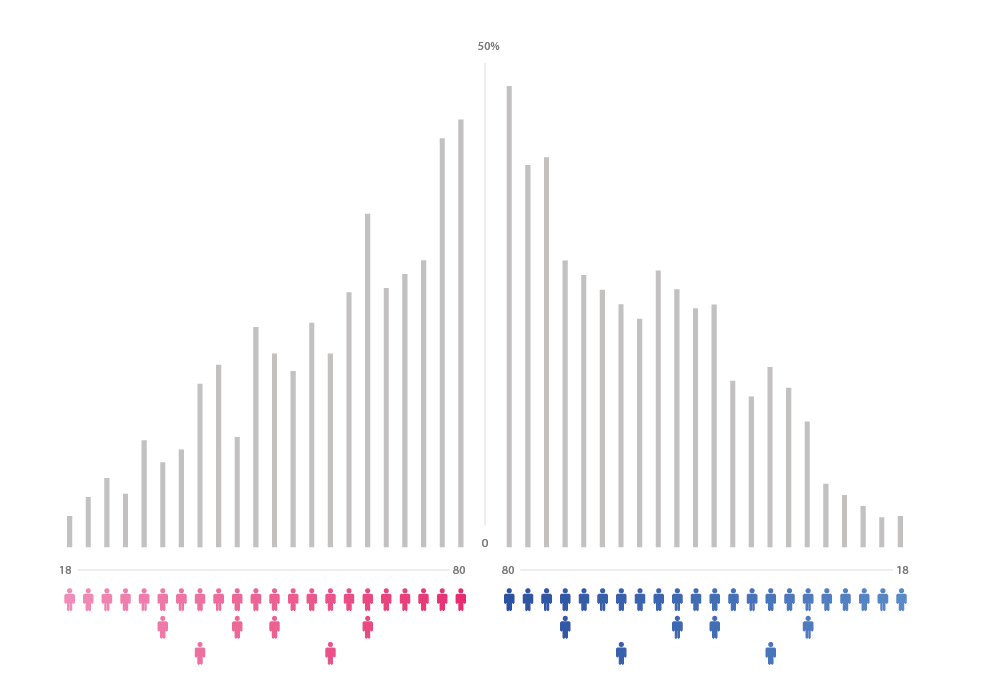
A record of how much time people spend smoking.
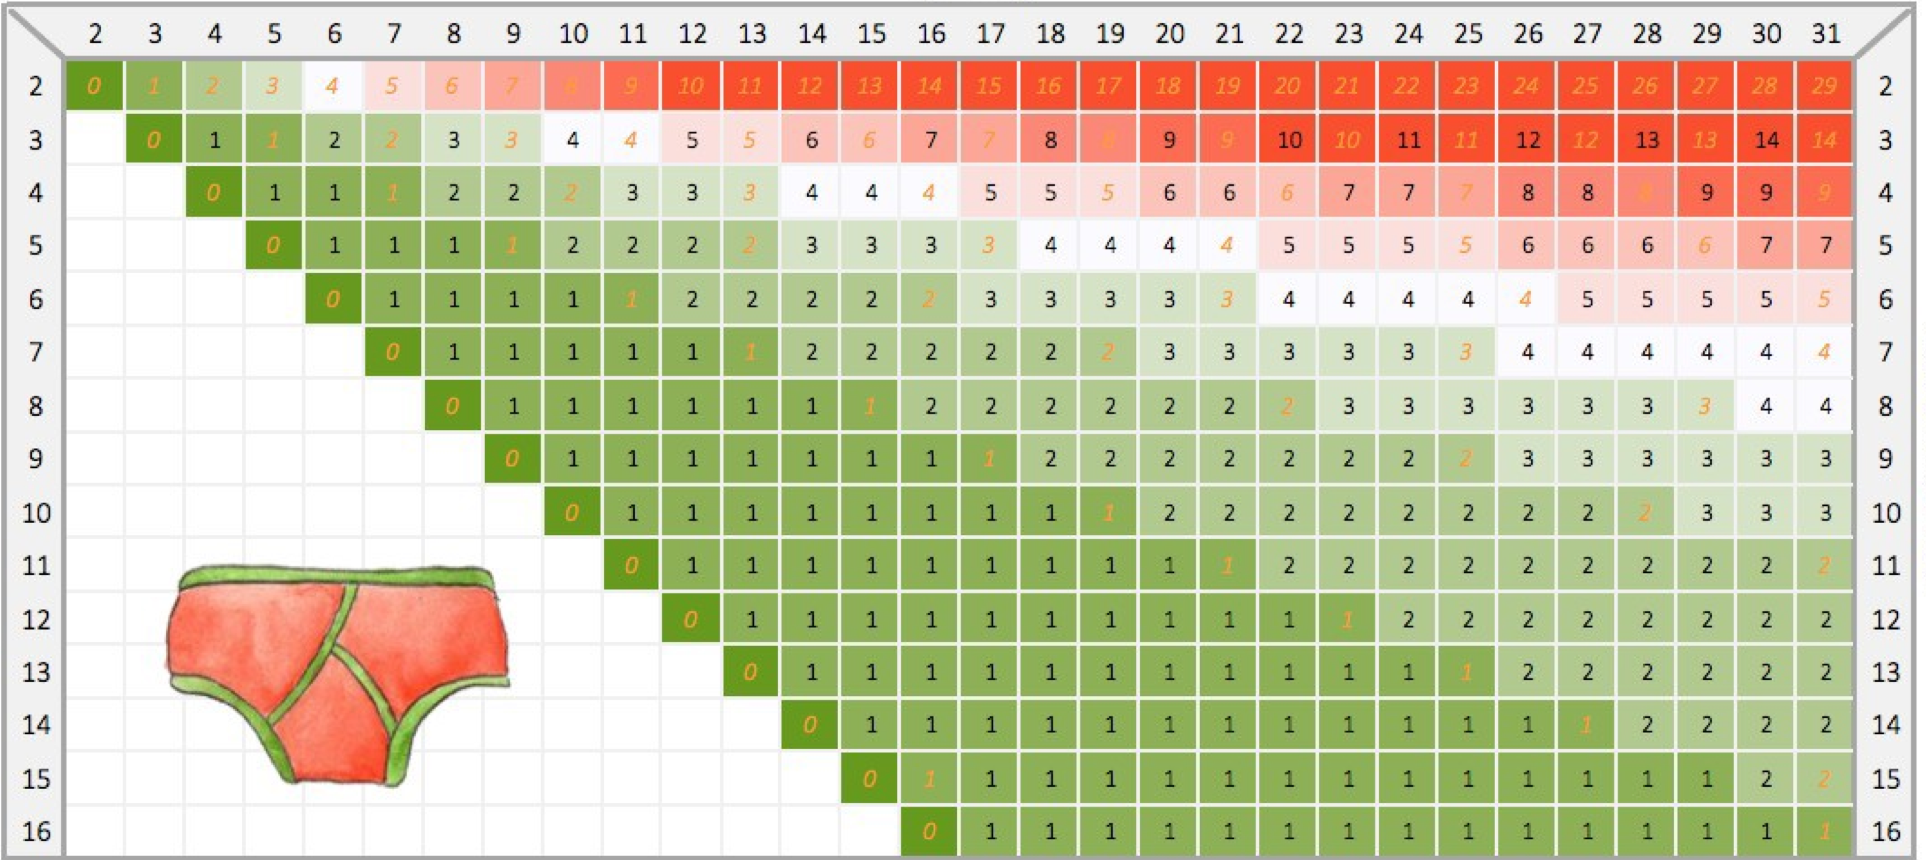
This Infographic is very usefully. It lets you know how much underware to take with you on a trip.
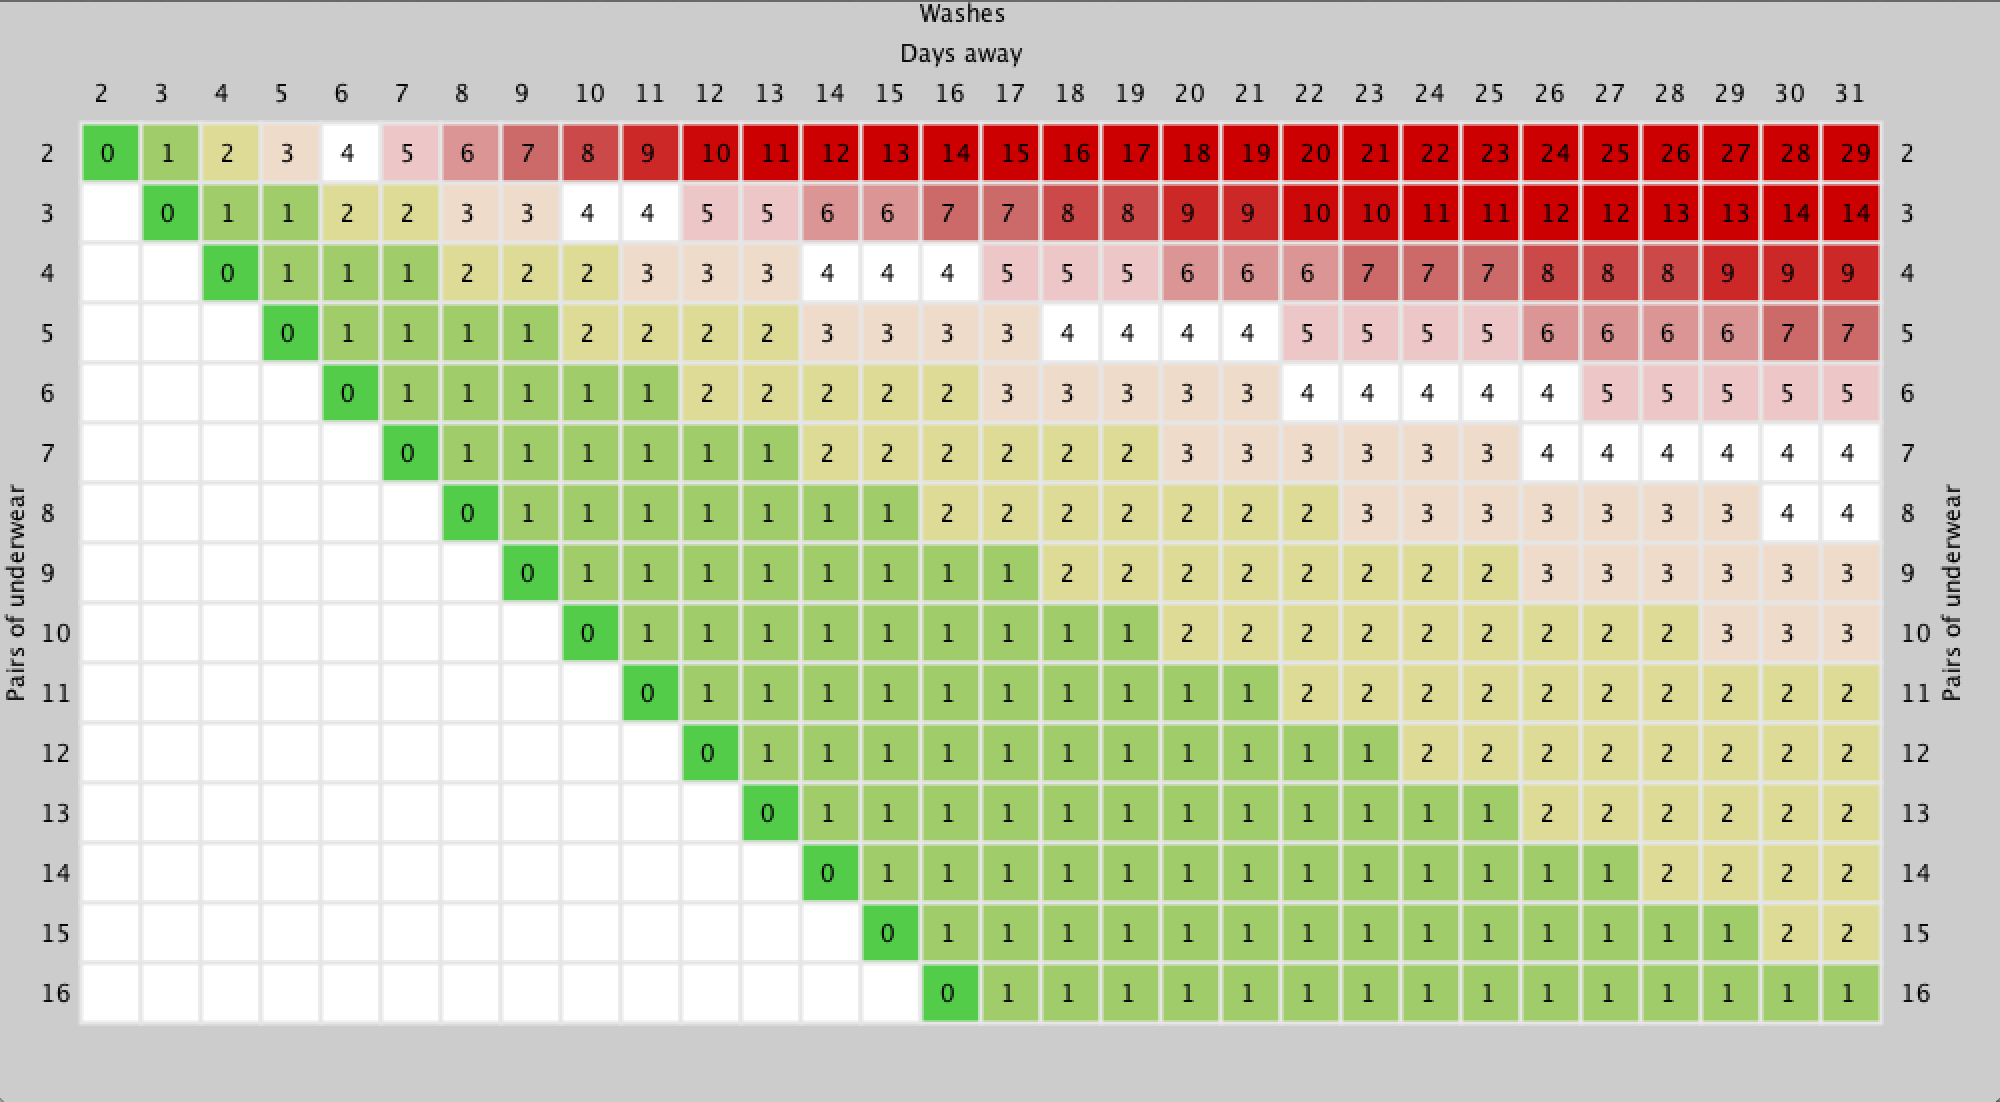
Here is the original:
https://medium.com/@sofauxboho/pack-like-a-nerd-2157aa39738f
Code: https://dl.dropboxusercontent.com/u/69234688/sketch_140922a.zip
This one is about how many policemen of what ethnic group are in a city and the ethnic of the population in comparison to that.
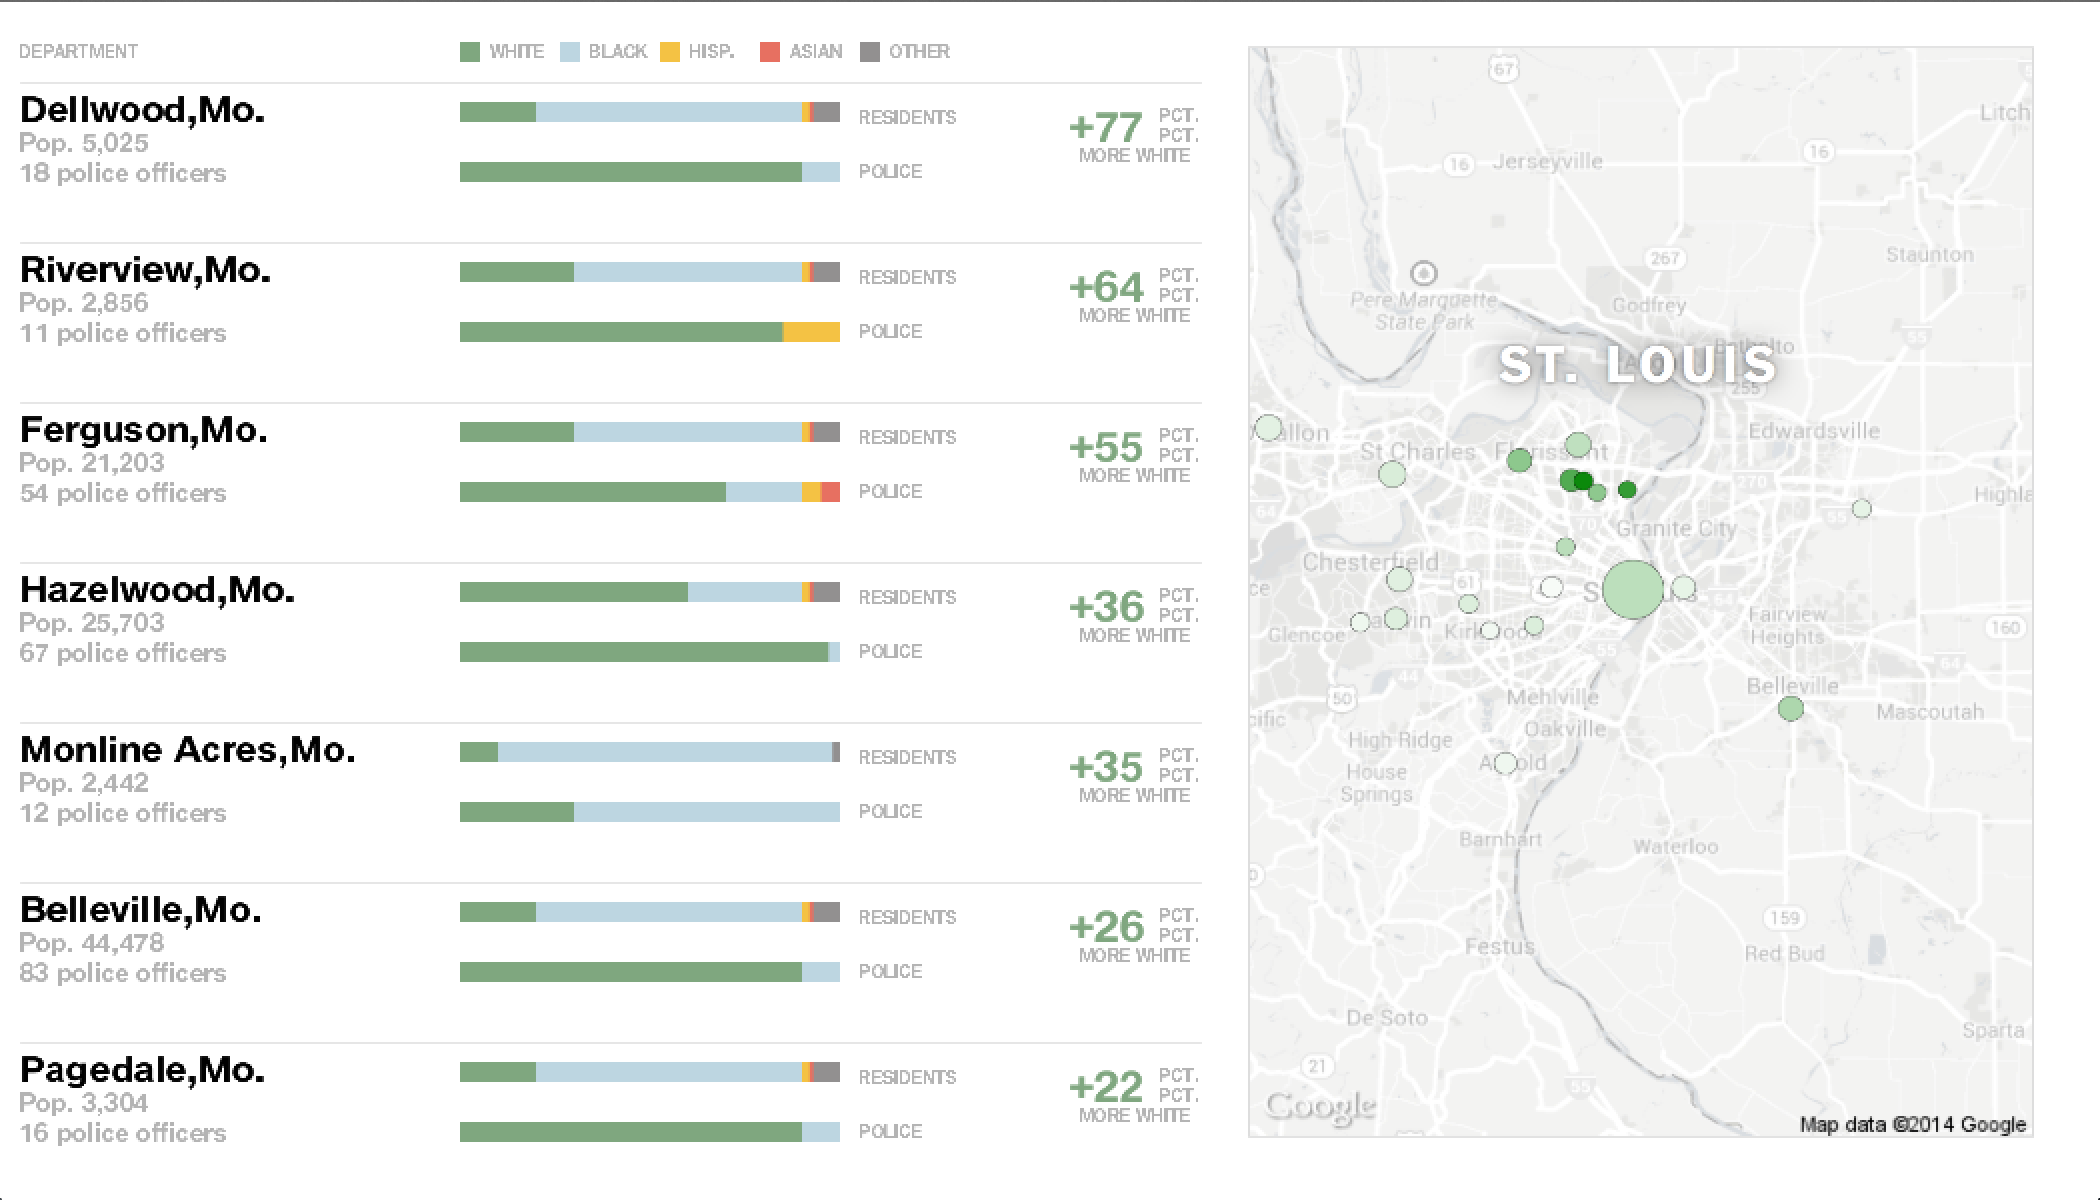
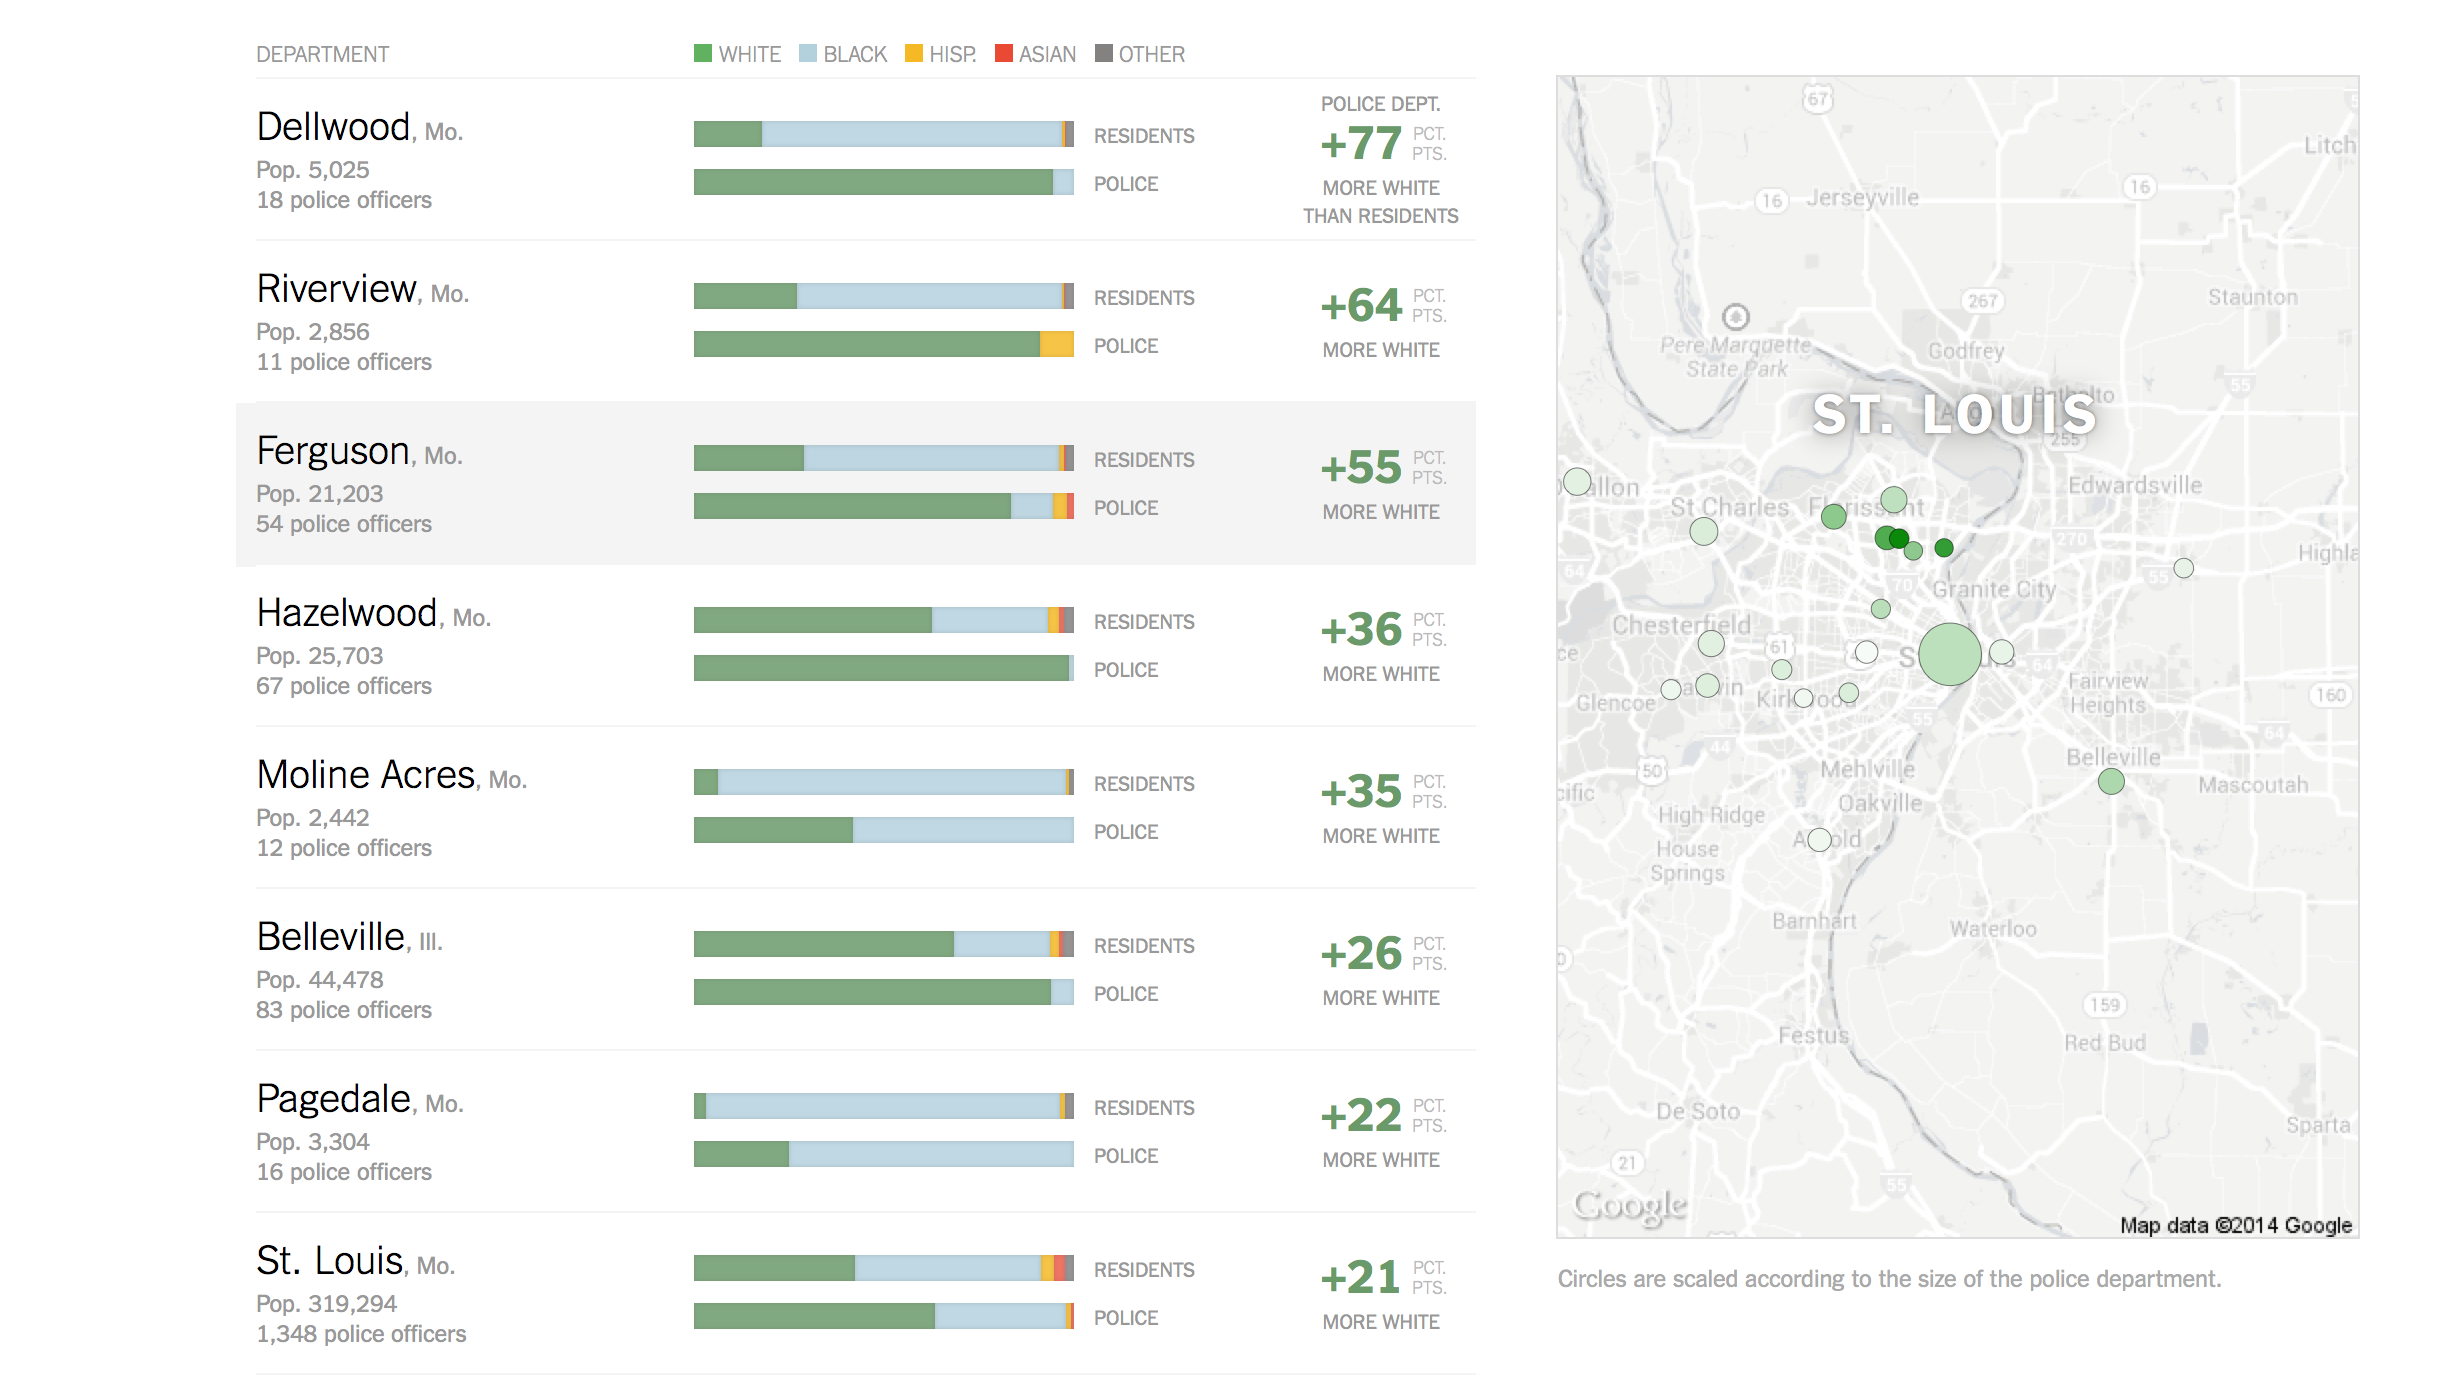
Code: https://dl.dropboxusercontent.com/u/69234688/sketch_140921a.zip
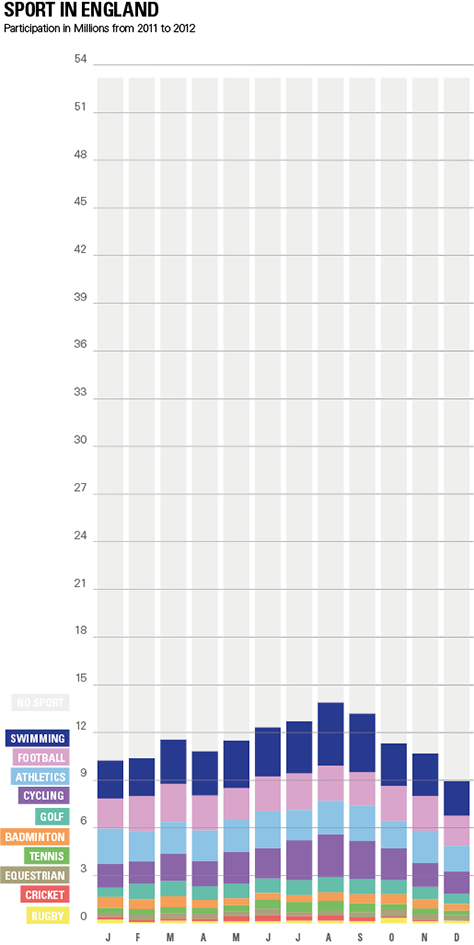
So I found this Infografic in one of the blogs that was posted by the class. It compares what kind of sports people in England did in the year 2005 and 2011. There are several problems I had with this visualization. Why does it compare these two years? The scale for each sport is differnt so its hard to compare them. There is a lot of text and the people, which don´t do any sports are not mentioned.
In my makeover I focused on a more general overview. The smaller sports are not equal to the big ones and you can easly see which sports could be called “others”. Also the trend in summer in more clear. I left out the comparison to 2005, because it was not obvious to me why to compare it with this year.
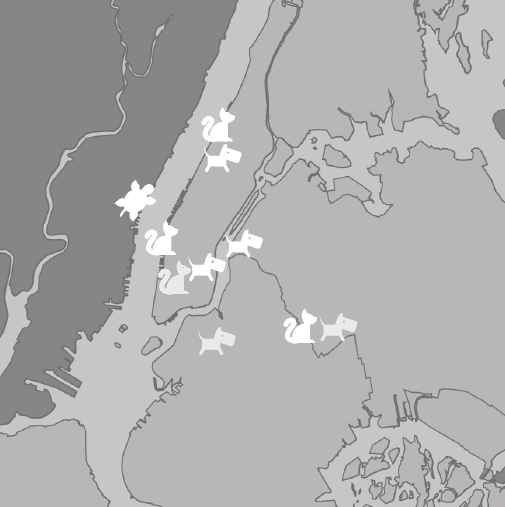
Its seems like there were more Pet-people in Manhattan.
Data Visualization Aggregator
A nice blog, mainly about Data Visualization. I think its a good collection of whats possible.
A visualization
These guys are dealing with forensic by visualizing data. In this case they want to prove that the Nato did on purpose leaf refugees to die. Its interesting to me how political the this can be.
http://www.forensic-architecture.org/case/left-die-boat/

Artist/Designer
A group of hackers from berlin. They are mainly dealing with maps. From information about political voting to search tools for parkingplaces, these guys are doing a lot.


Visualization Tool
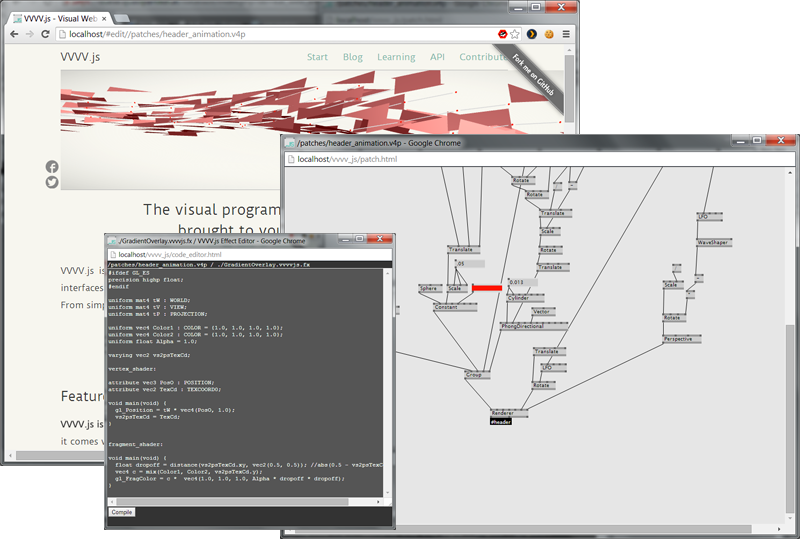
A nodebased programming language. There are several cool projekts done with it. They also have a convention in Germany: http://node.vvvv.org/.
Data Collection Tool
A sniffing tool made with processing. I´m sure there could be some really nice projects made about all the data of people, which didn´t know that they send it out there… unlocked.
Discussion Forum
A speech about the try to map social topics on food.
http://www.youtube.com/watch?v=rf9C4Prjkmc
Data Source
Lots of geojson files, if you want to do stuff with maps.
https://github.com/johan/world.geo.json/tree/master/countries/USAhttp://
Data Ethics
A german convention, where freedom of data and use of data is a big topic.
A Book
I happen to know Sandra from work. The Book is a really good collection of infografics/datavisualizations.
http://www.amazon.com/Information-Graphics-Sandra-Rendgen/dp/3836528797