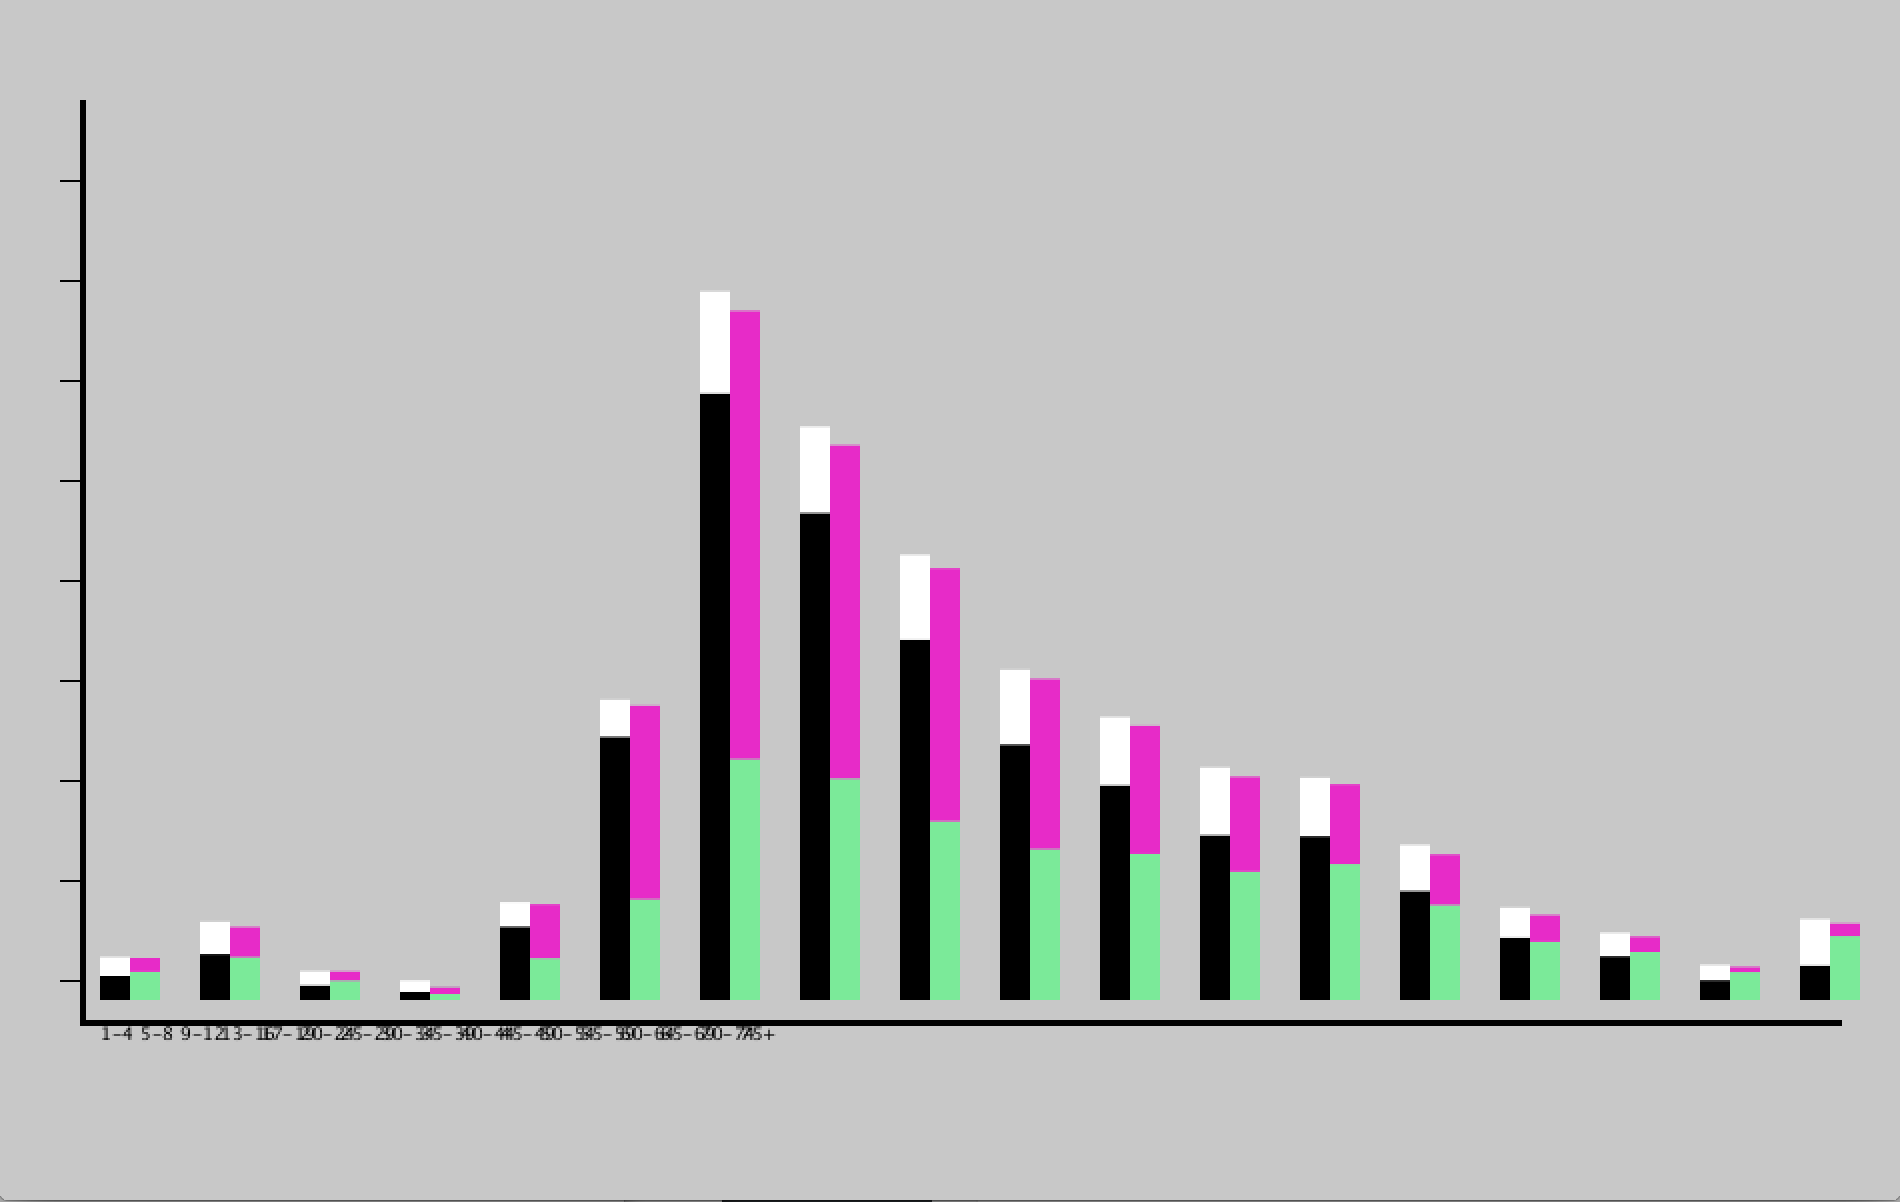
For my Code Warmup Part 2, I chose data I found in the FBI database. One thing I am interested in, among many, is crime and the justice system so I took a look at one of the several data charts the FBI website contains. I looked at murder victims in 2012 by age, gender, and race. Age was most interesting to me and can be easily seen through a bar graph rendering. I decided to try the stacked bar code to figure out how much I can add/alter to the stacked bars. It was going well until I tried adding an additional set of information to my float array ([][][]) but it took forever and never worked out. I cheated by adding my additional information to ‘race’ as a last stacked bar using illustrator, just by aligning to the ‘gender’ bar stack to add up to the total population.
It was interesting using Illustrator with Processing because Processing did the “easy” work of inserting data and spitting out the image while Illustrator does what it does best and let me design the data 1-2-3. While I thought that time would be on my side for this assignment, given the easier way of doing things, code still takes up most of it–always trying to figure out what the hell went wrong…over and over again. I would like to know exactly how you can add more bars to the stack for future more complex sets of data.
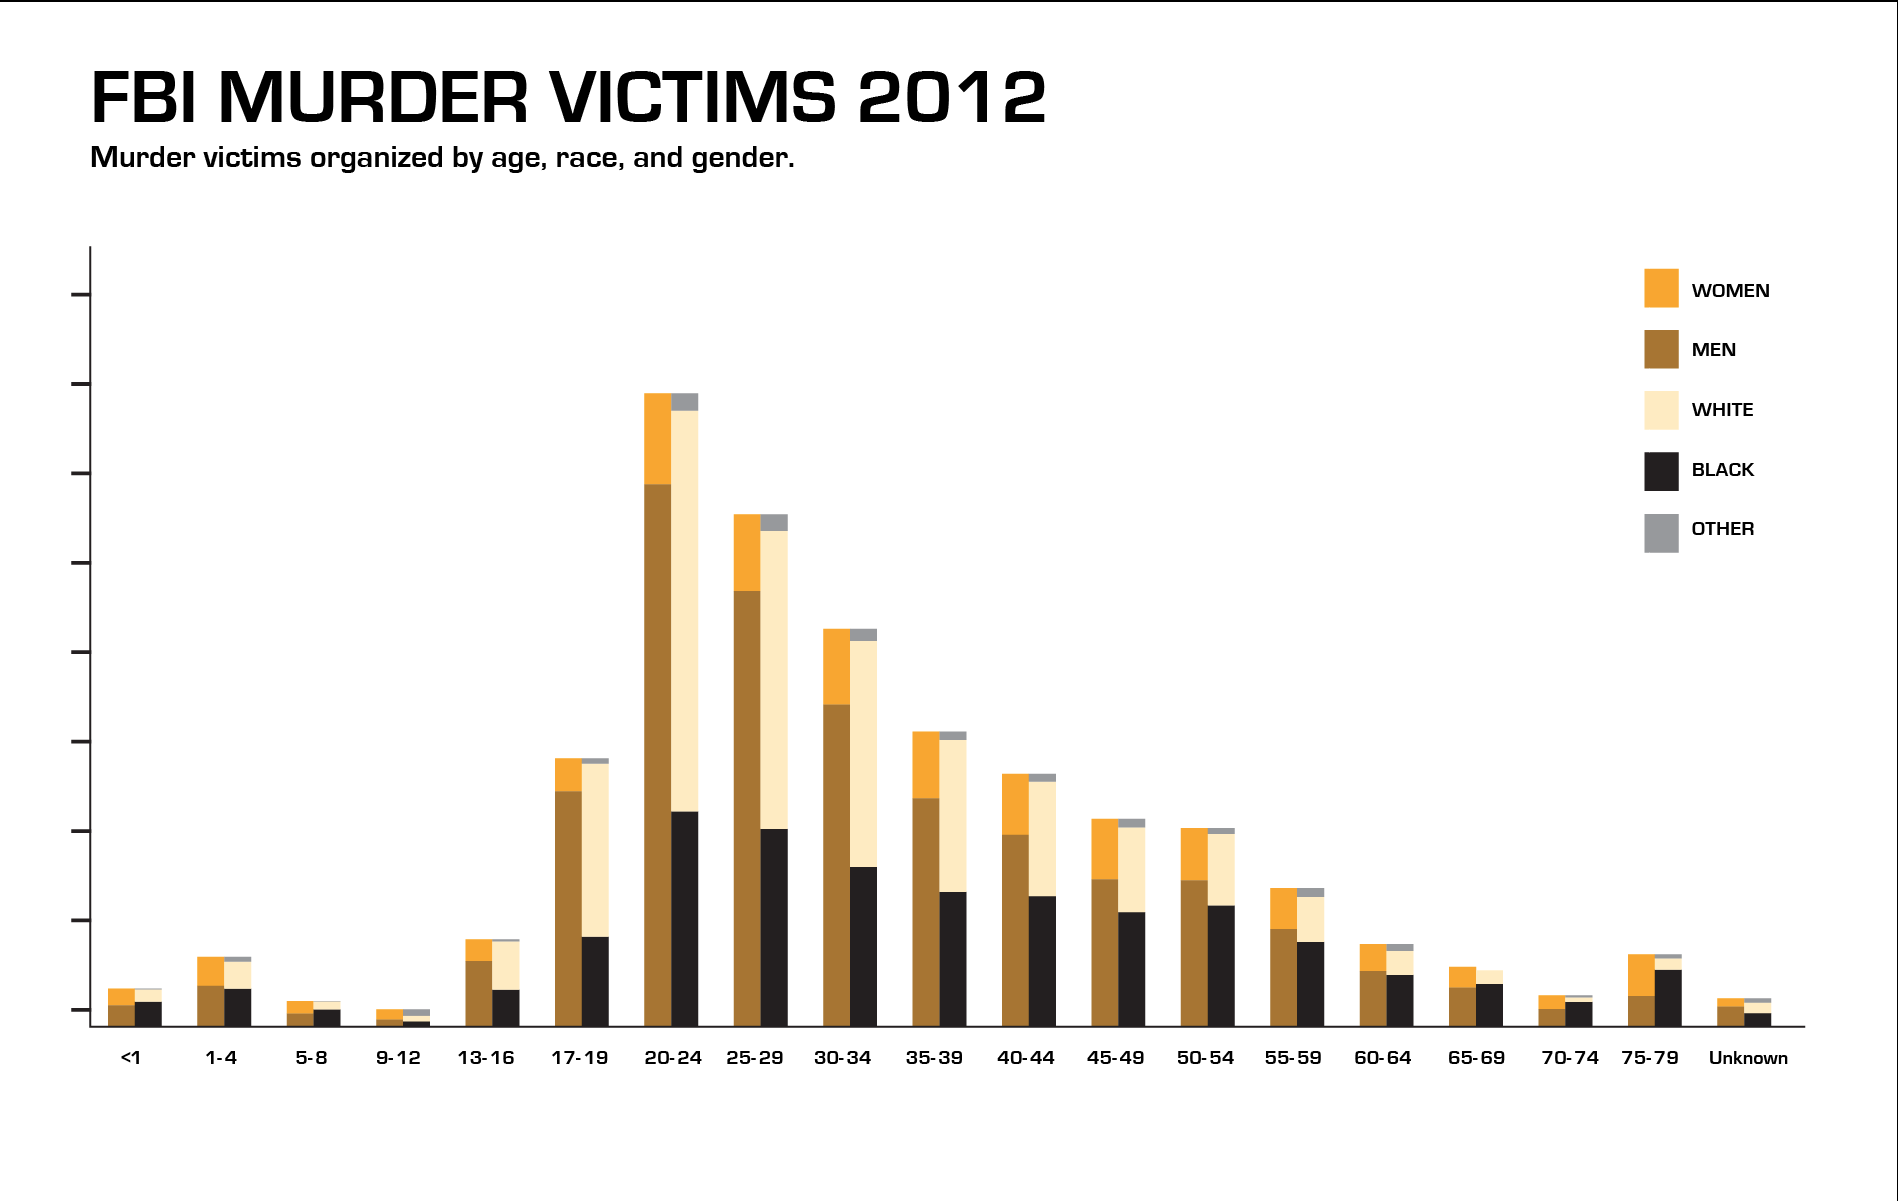
Finished result
How it looks in Processing (pre design)