All posts by Anne Schirner

Proposal – Little Big Data

The Arab Spring Revisted
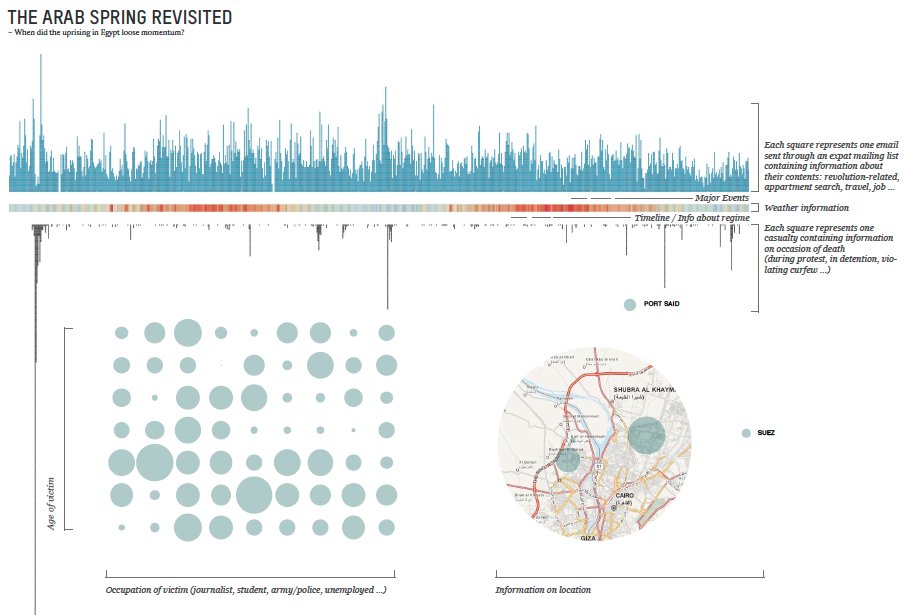
On January 25, 2011 Egyptians took to the streets to protest peacefully against President Hosni Mubarak, calling for social justice and democracy – sparked by the death of a 27-year old man from Alexandria at the hands of the Egyptian police. On February 11, Mubarak resigned. Over the following three years the country went down a bumpy road resulting in more than 4000 casualties.
The key question that is guiding this visualisation is: When did the uprising in Egypt loose momentum? By confronting casualties during this popular unrest in Egypt with corresponding weather conditions and the number of messages sent through CairoScholars, a mailing list that serves expat students and scholars, the visualisation will investigate that matter.

cairo_protestMany Feared Dead As Egyptian Security Forces Clear Cairo Protest Camps

The Data
WikiThawra is a database compiled by a non-profit cooperative, which contains data about of every single person that died since the outbreak of protests in January 2011.
It provides information on day, place, occasion of death, name, age and occupation. The reason of publishing this continuing database is to keep track of incidents happening at fast pace and to remember … This database will be the main source for the visualization. The weather data is provided by an online archive. The data on messages exchanged during the time I have access to through a listserve hosted by UT Texas.
Casualties: http://wikithawra.wordpress.com/casualities/
Messages: https://utlists.utexas.edu/sympa/info/cairoscholars
Weather: http://www.wunderground.com/history/

Approach/Tools
The first and most time-consuming step is going to be to sort and clean the data. Once the the data set is fixed I will use Processing and Illustrator to visualise the data. 

Comp
my proposal:comp
Makeover Assignment

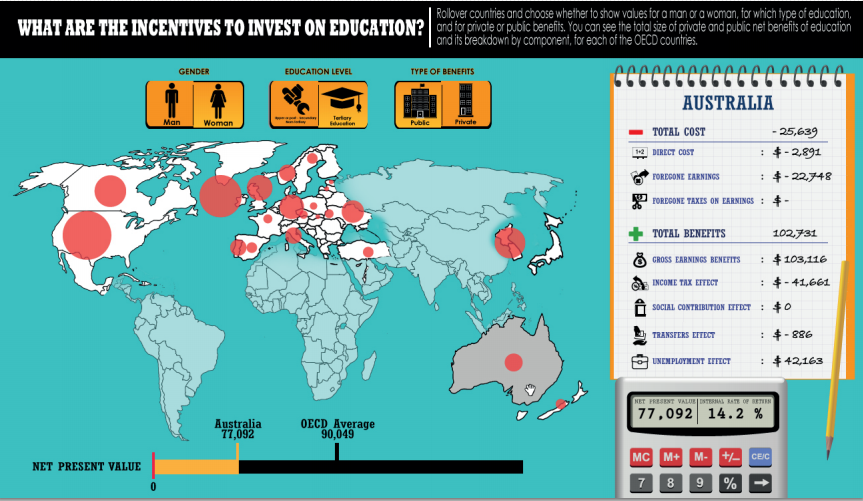
original visualization

>>link

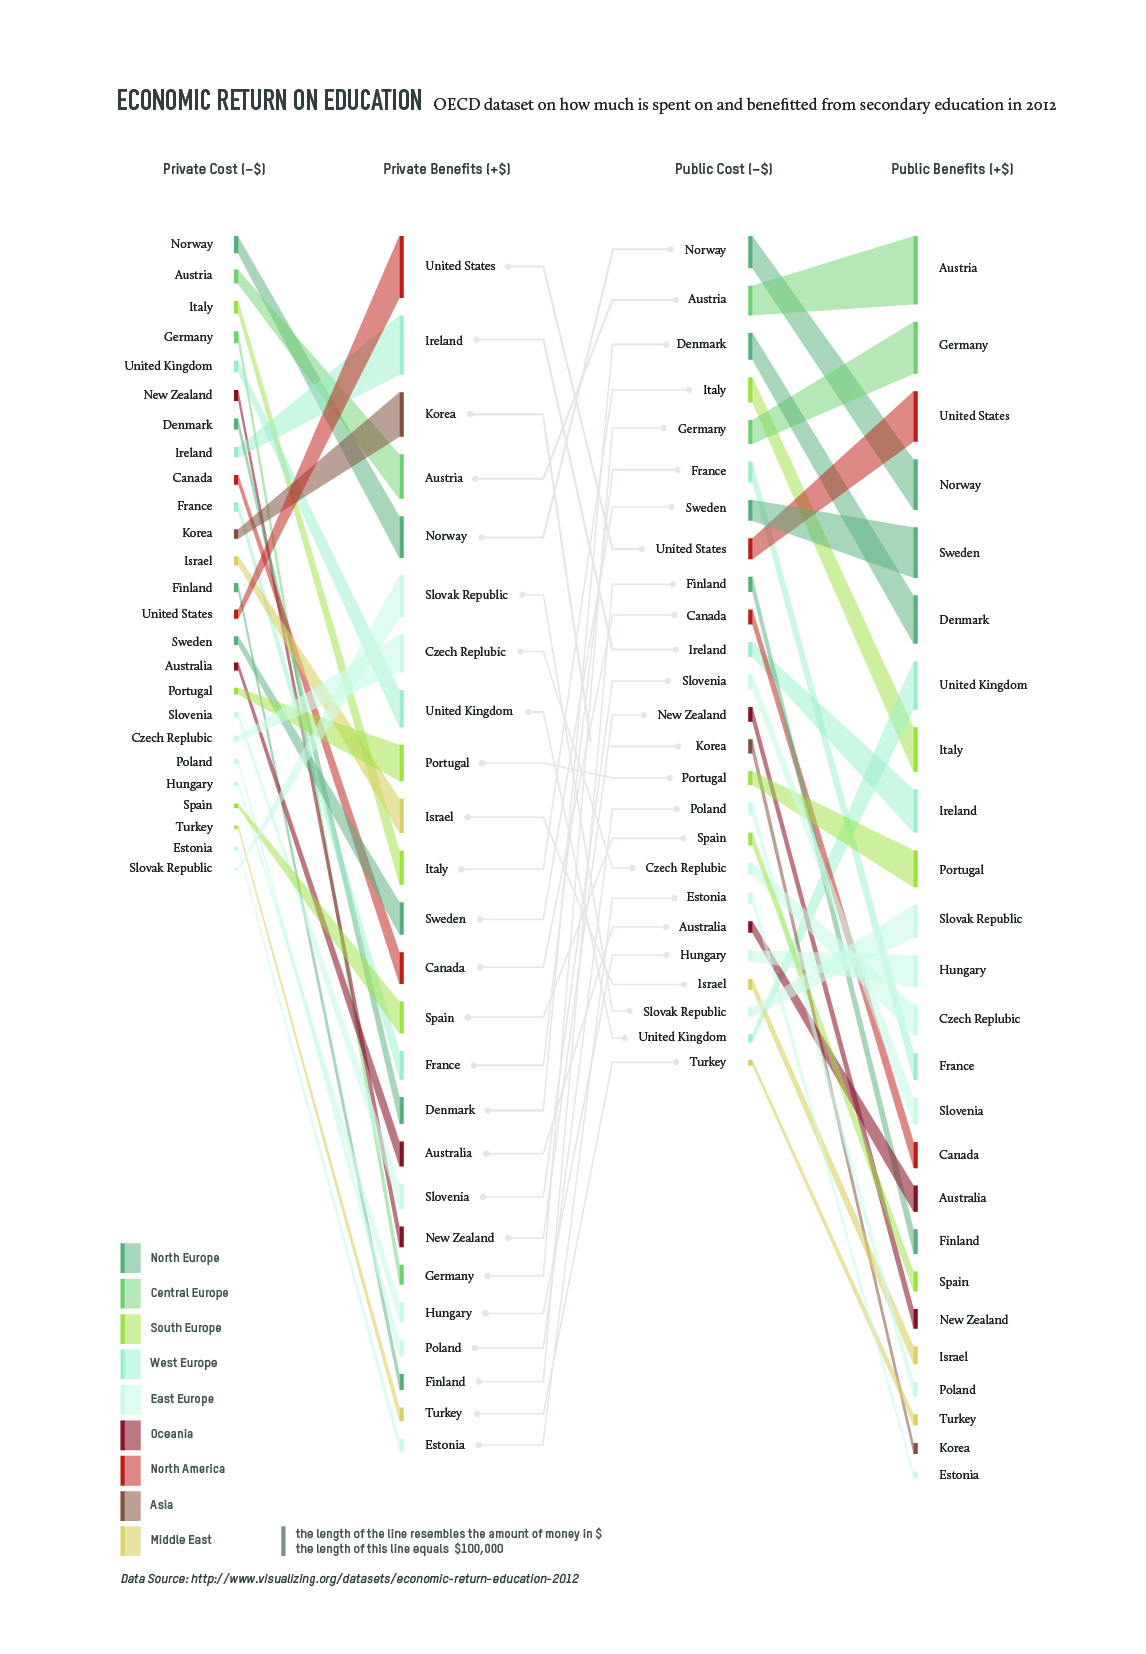
my solution
my solution

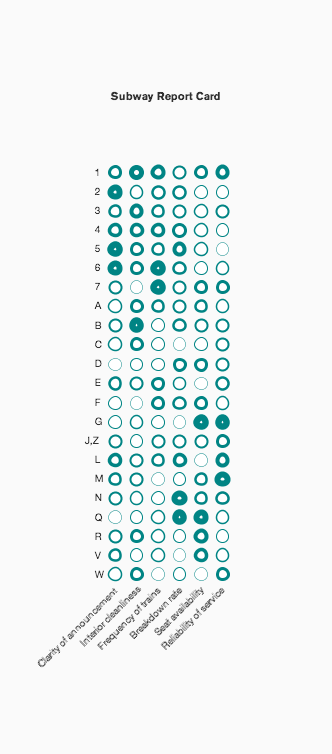
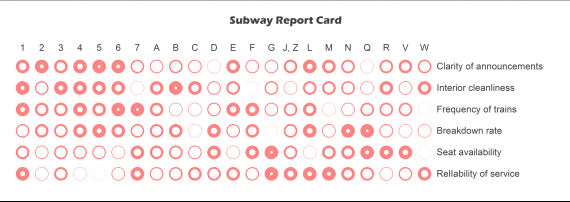
I came across this visualization on visualizing.org on economic returns on education, which provided information on the data source as well (OECD Education at a Glance 2012). The data set contains data on the costs and benefits of secondary and tertiary education for private and public bodies.
While the original displays the numbers interactively, my aim was to focus more on trends and patterns but still create a readable representation of the matter. My solution contains less data than the original, it is not more than a sketch with the option to include more data levels (gender, detailed break up of costs and benefits etc.)


Research Assignment

Data Visualization Aggregator
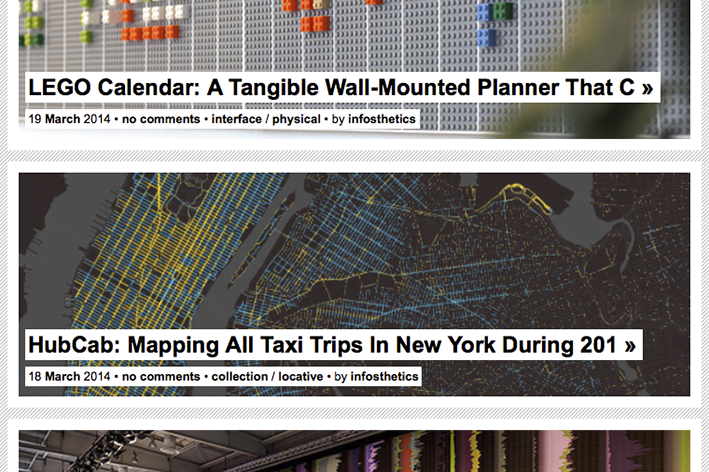
1_infosthetics
Information Aesthetics

A blog featuring projects that represent data or information in
original or intriguing ways. It is designed and maintained by
Andrew Vande Moere, an Associate Professor at KU Leuven
University, Belgium.
http://infosthetics.com


A visualization

2_amanda cox_The jobless rate
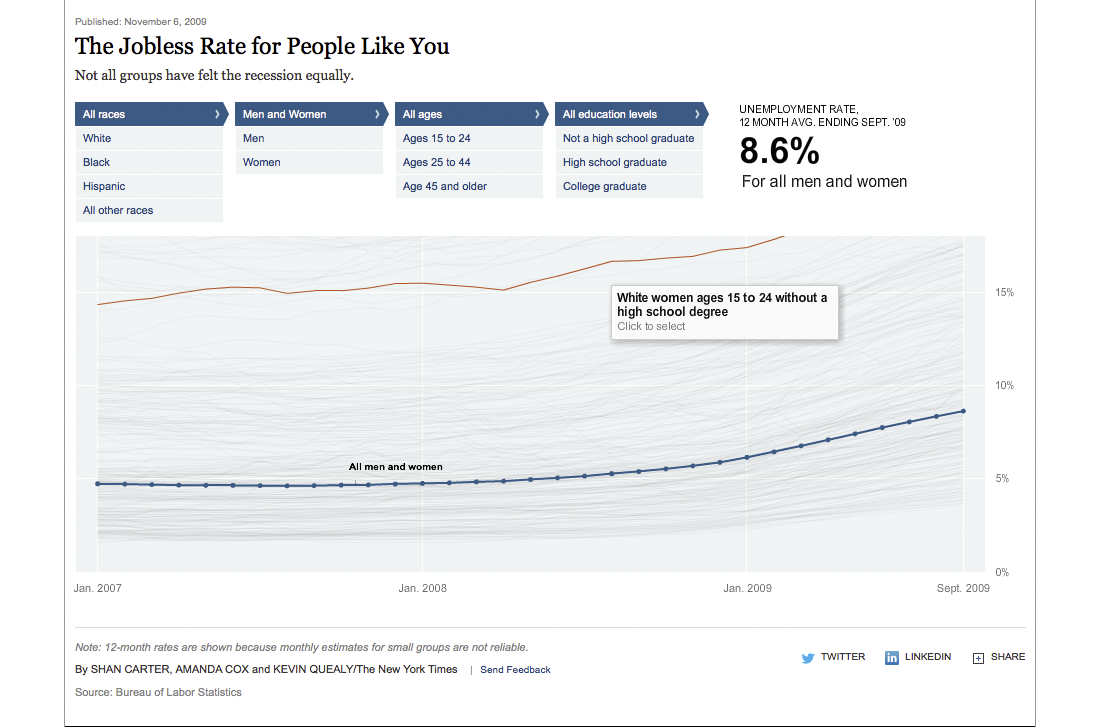
Amanda Cox (New York Times): The Jobless Rate for People Like You

An interactive data visualization that shows various demographics (race, age, gender, education) and the corresponding unemployment rates in the US during the months following the recession in 2007/8. It makes you want to explore …
http://www.nytimes.com/interactive/2009/11/06/business/economy/unemployment-lines.html


Artist/Designer
3_stefaner_betterlife
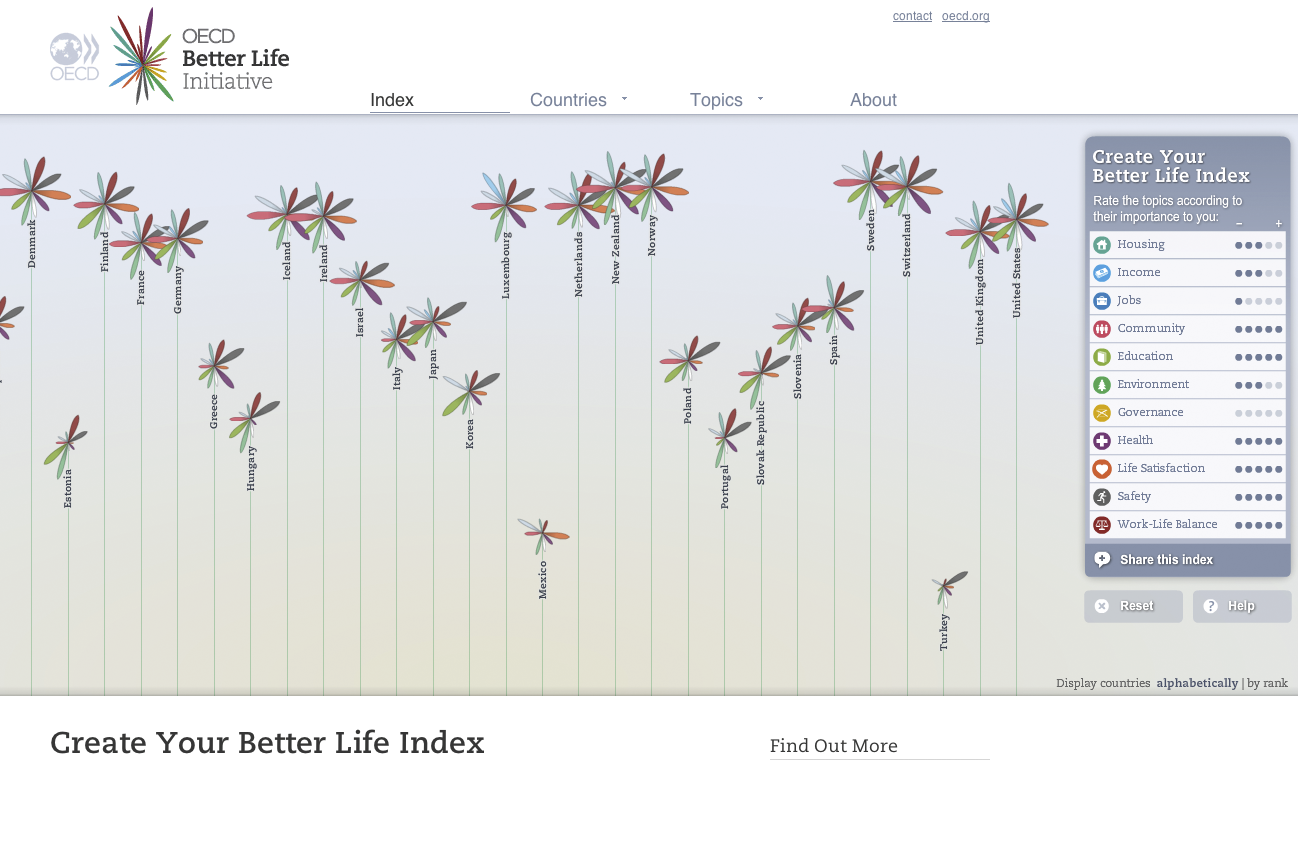
Moritz Stefaner: OECD Better Life Index

Information visualizer from Germany who calls himself Truth & Beauty Operator. With a background in Cognitive Science (B.Sc.) and
Interface Design (M.A.) he created an extensive body of work during recent years with clients like OECD, dpa, Skype, FIFA.
http://moritz.stefaner.eu

Visualization Tool
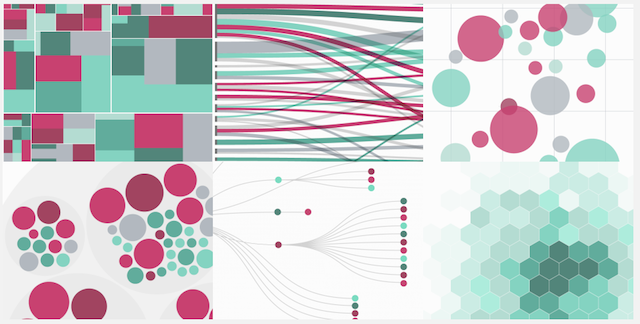
RAW by DensityDesign

A link between spreadsheets and vector graphics. This handy
online tool allows to upload data, explore it and export the visualization in vector format (SVG) which you then can edit with e.g. Adobe Illustrator …
http://raw.densitydesign.org

Data Collection Tool
Facebook network visualization

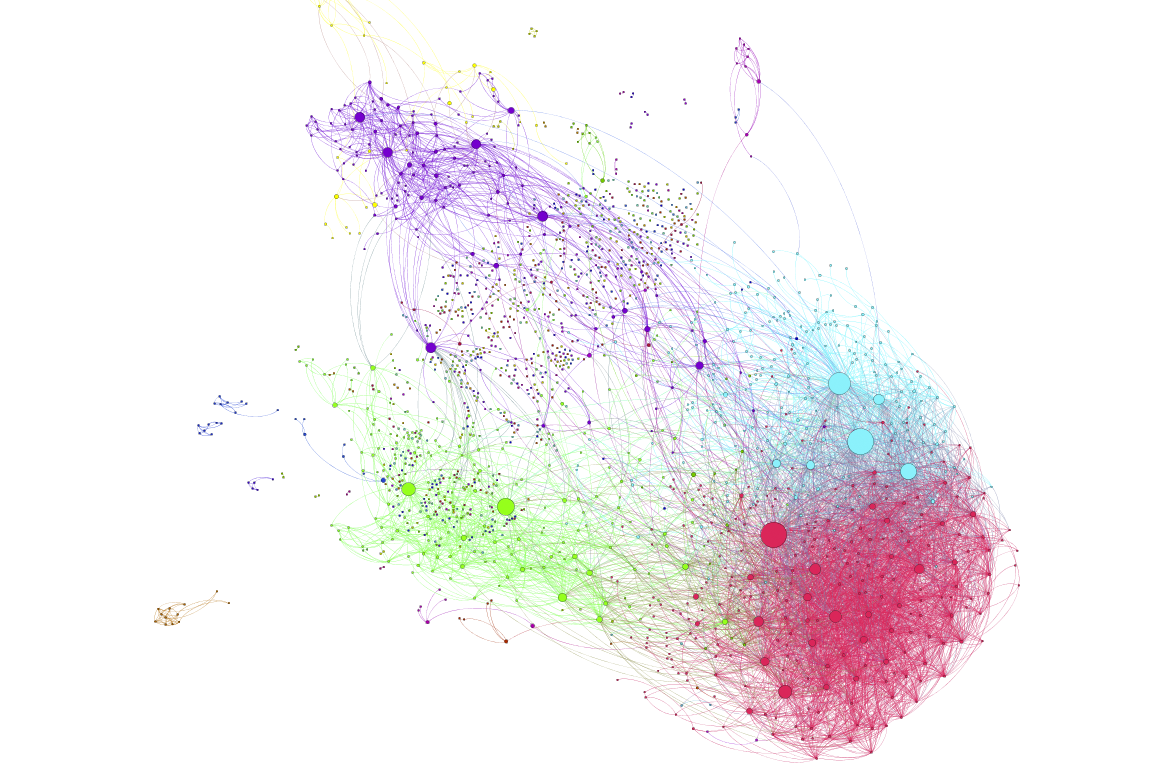
Network visualization of Facebook data done with Gephi, a network analysis and visualization tool. The data can be extracted using Netvizz, a data collection and extraction application.

Book

Data Flow 2 by Gestalten


It is not the most up-to-date book on the subject, but a beautiful overview  of some important work done prior to 2009. It expands the definition of information visualization by including also 3D approaches. There is also the preceding publication Data Flow 1.