MAKEOVER ASSIGNMENT
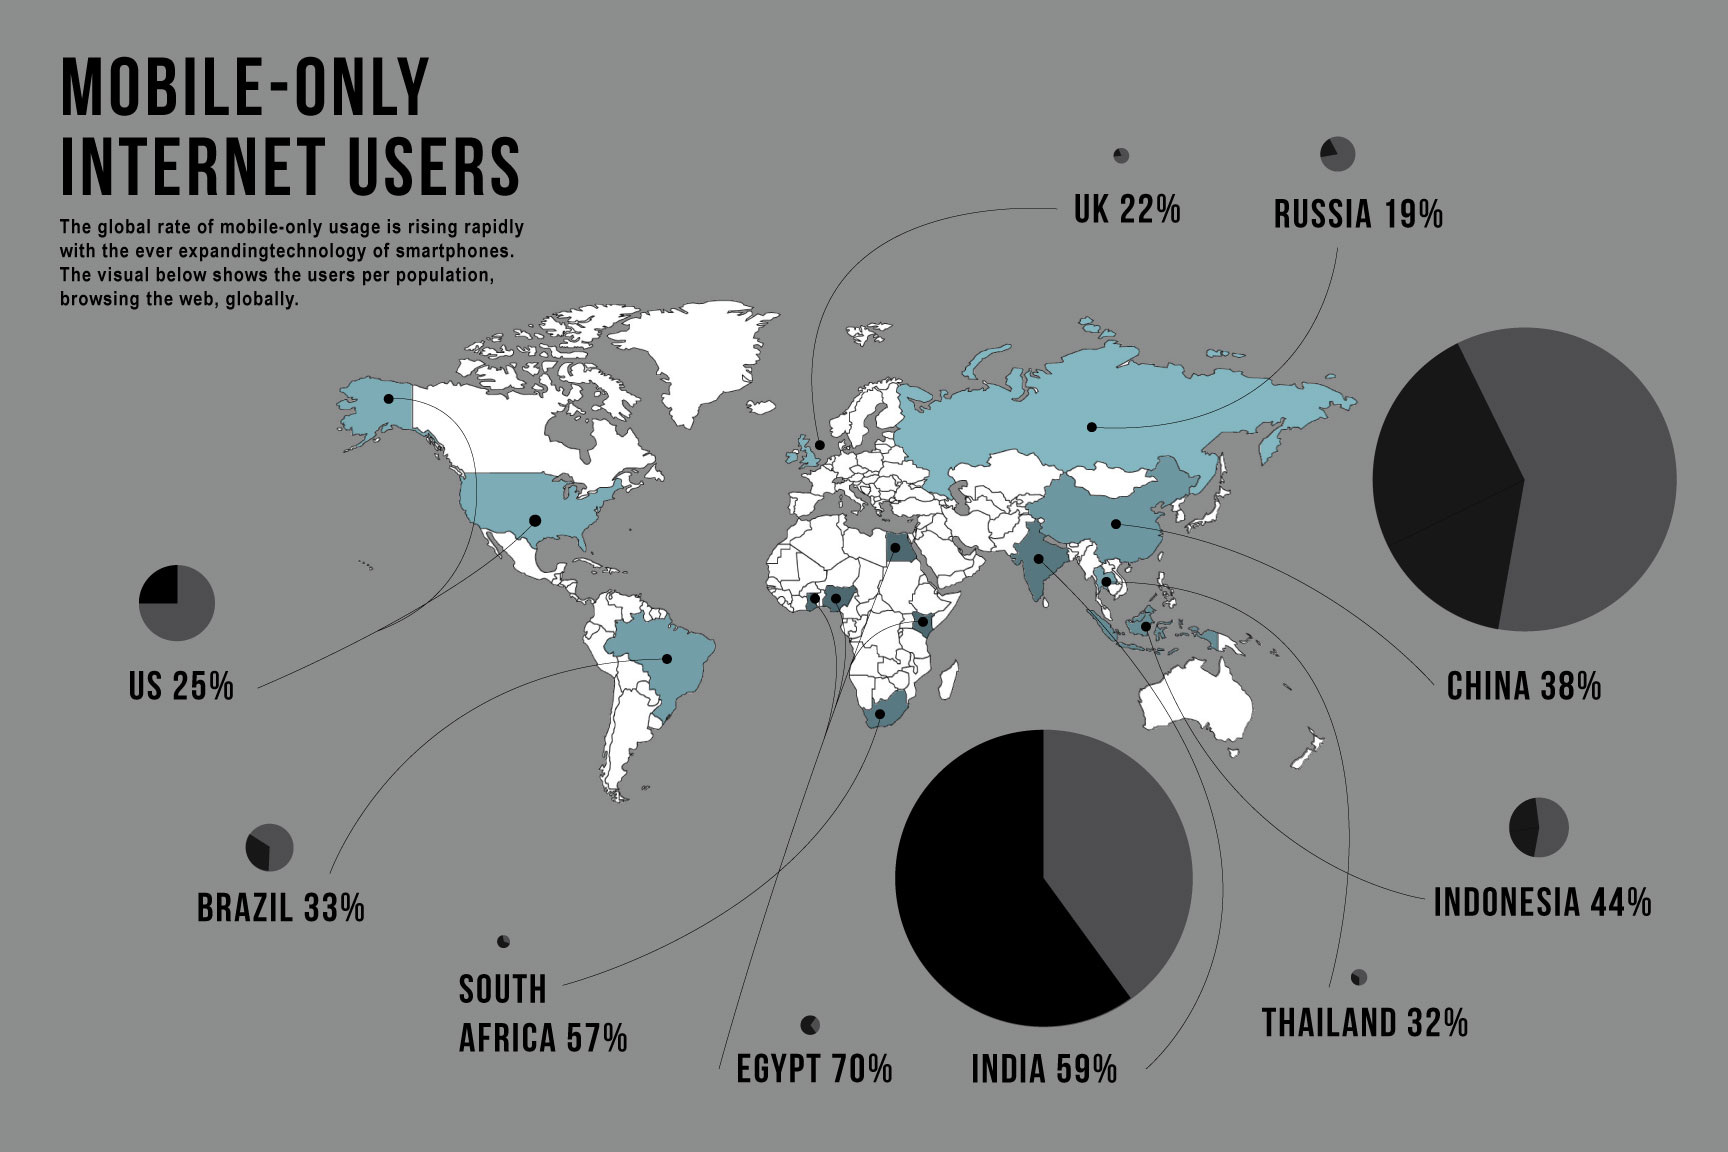
After searching for a data visualization to redo did I realize how many terrible data visualizations there are out there. In many ways, they can confuse, overwhelm, and/or un-impress. This info graphic was not so terrible and simple to look out but held little information that was not rendered for impact to the viewer. The visuals were supposed to show what percentage of each country’s population were mobile-only internet users. The size of the bubble for each country’s label is supposed to show the percentage size compared to other countries. The map shows the location of each country, the gray areas shows the countries that didn’t have sufficient data.
My info graphic is different in that instead of visualizing just the percentages comparing each country, the viewer can also see the population of each country, the percentage of mobile users in comparison to that country in order to see numbers overall of users. In the original map, Egypt has the largest circle because 70% of its population is mobile-only. However, in the new map, India and China have a lot more people that are mobile-only despite the fact that each hold a lesser percentage than Egypt. The color of each country changes as well, showing the density of users in comparison, the countries with a low percentage are a lighter blue while the higher percentage are darker.