All posts by Ariella Saragossi

Final Project

Final Project

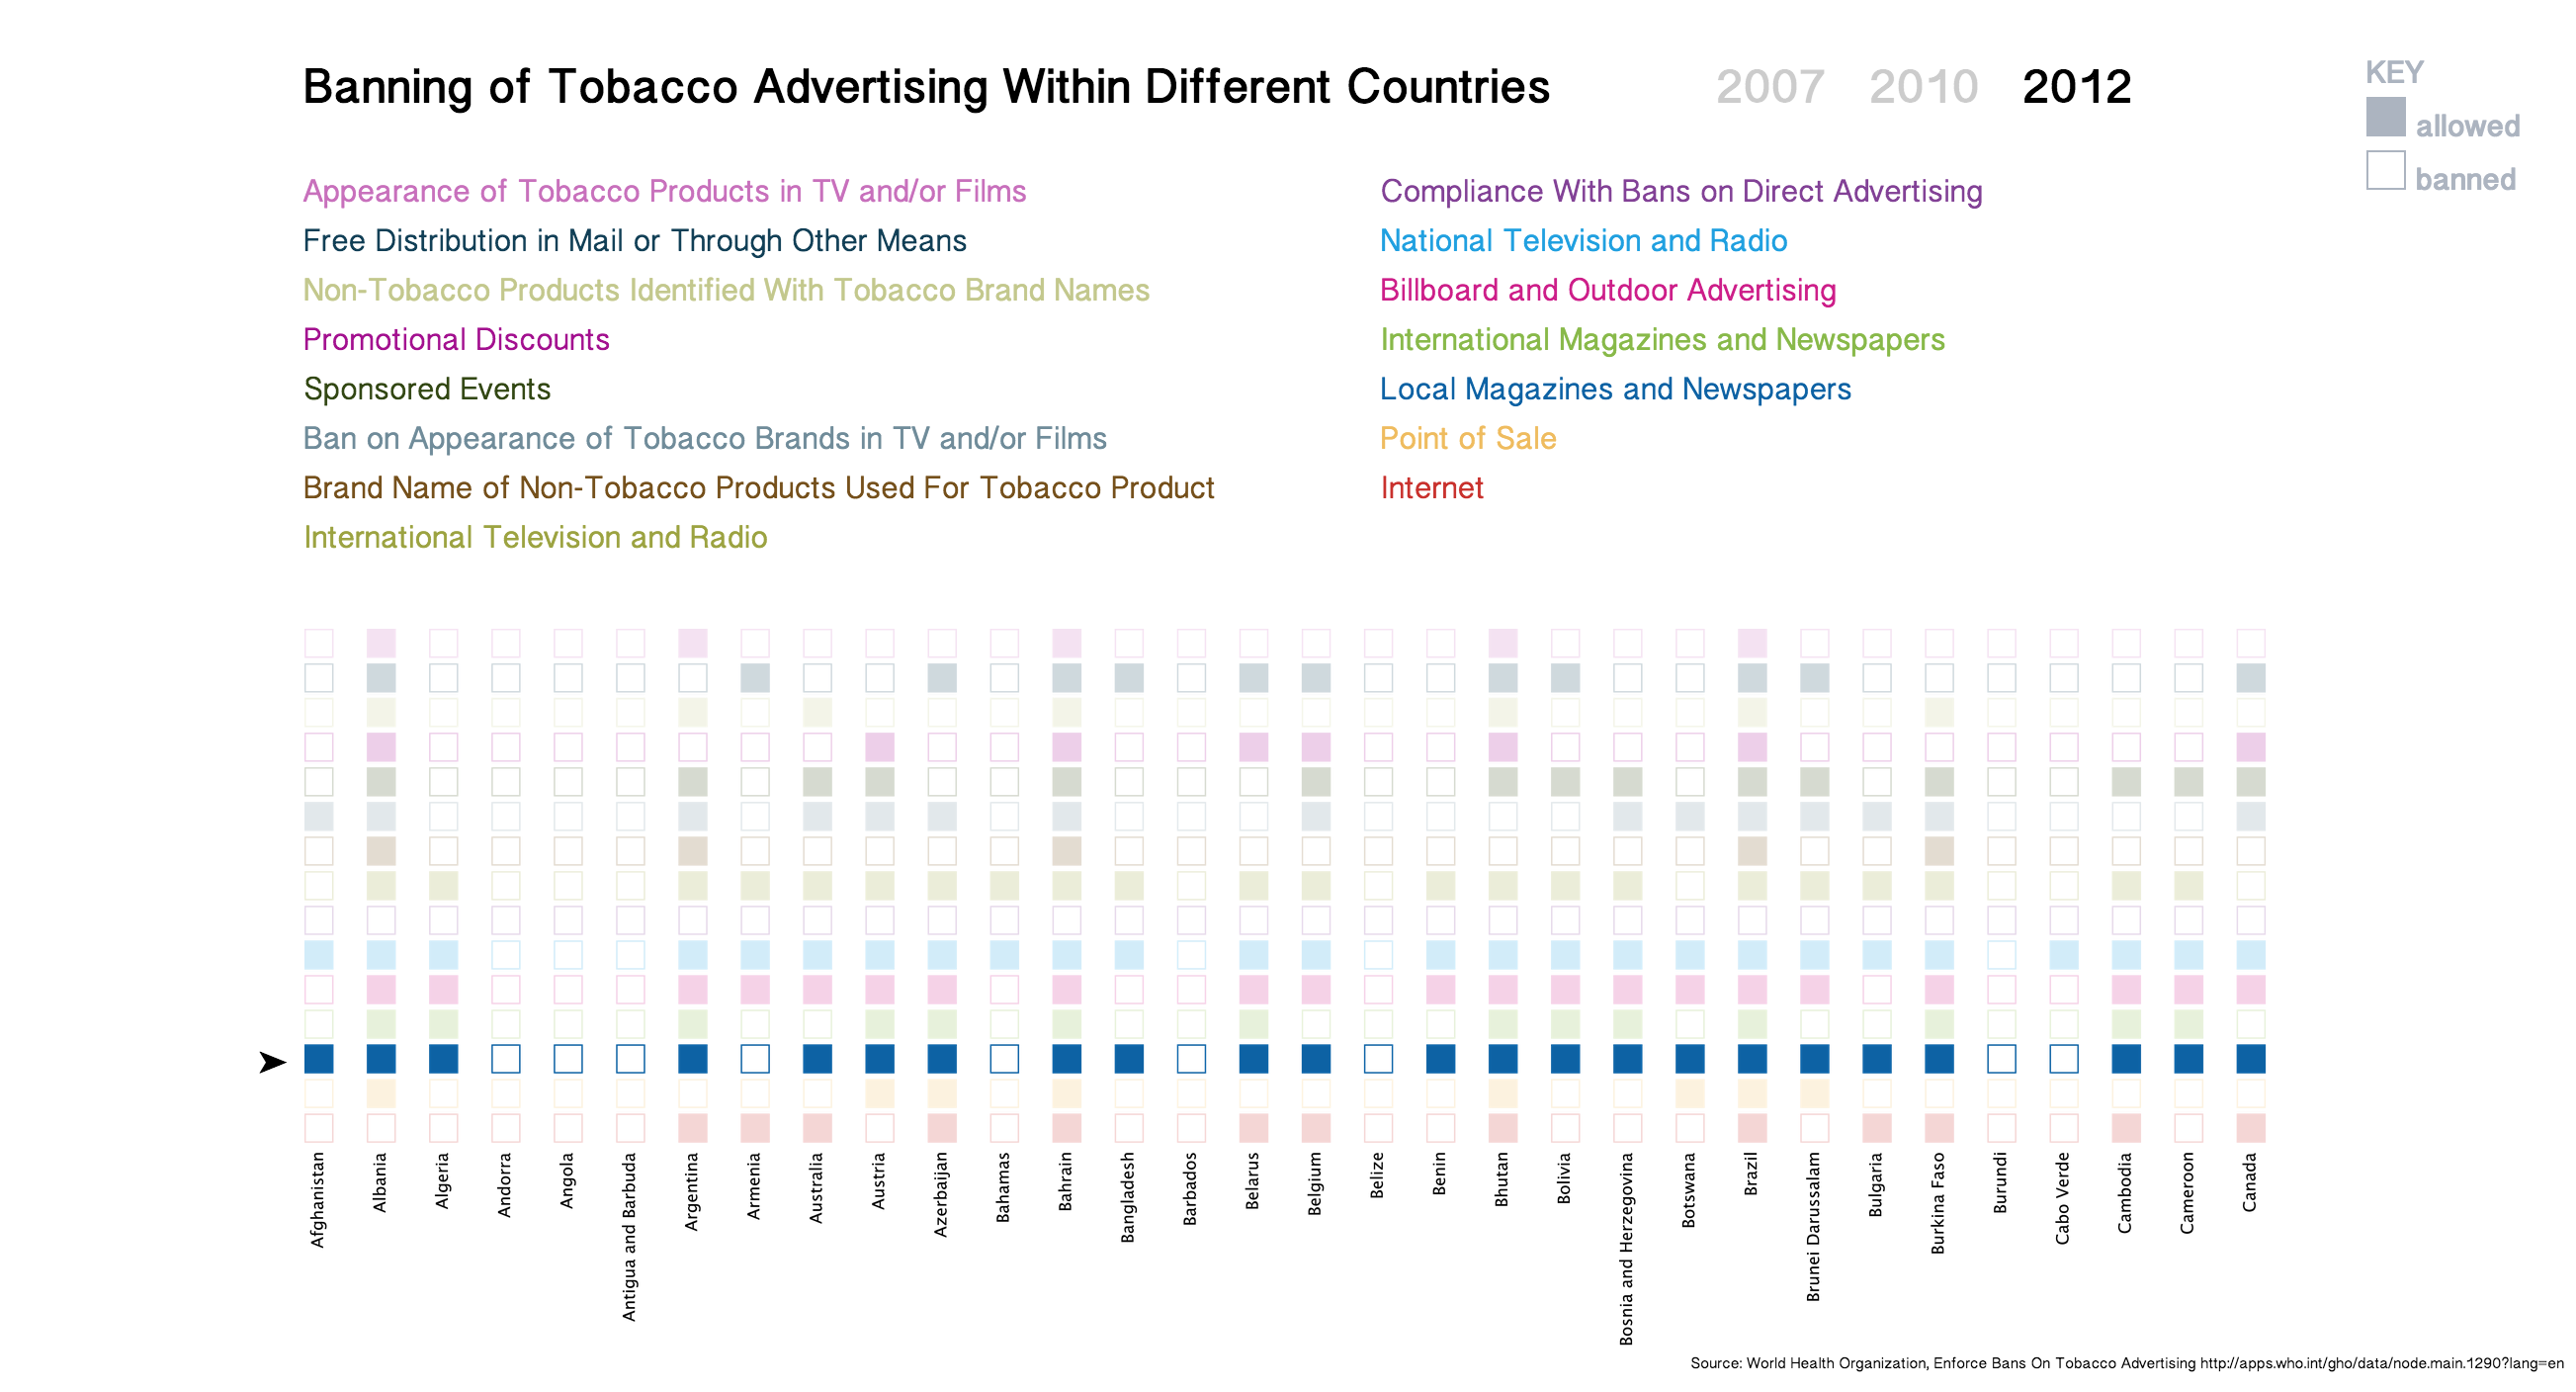
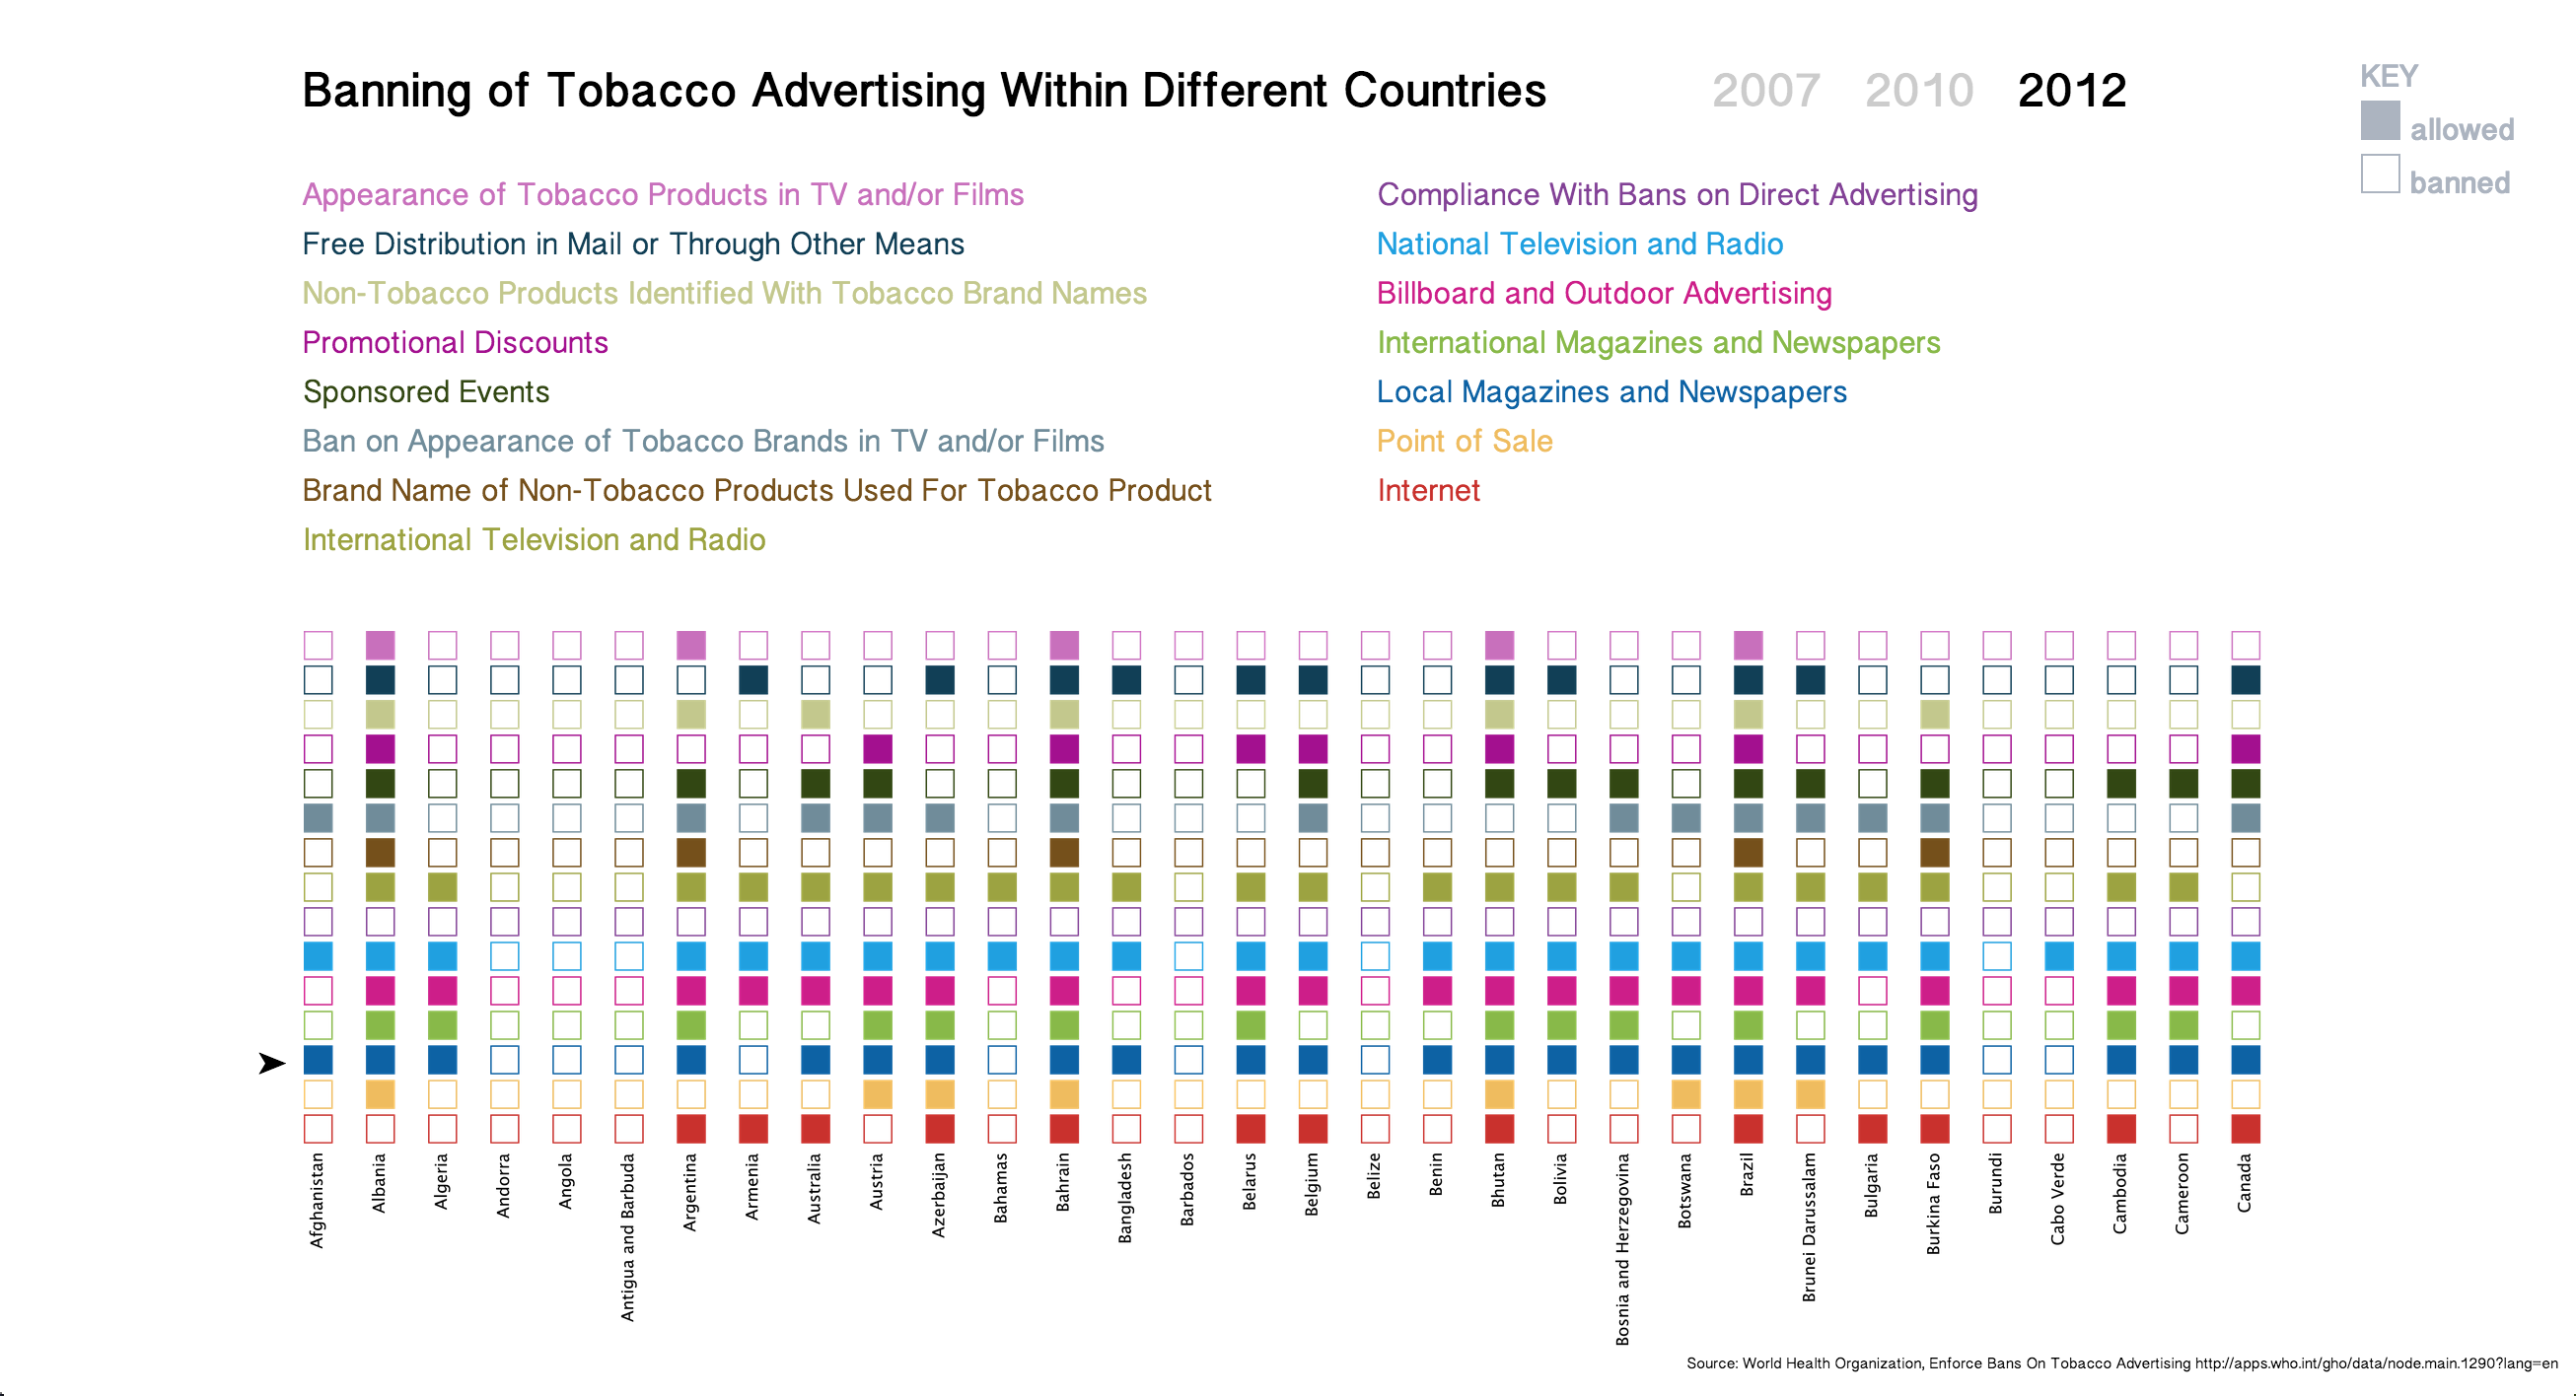
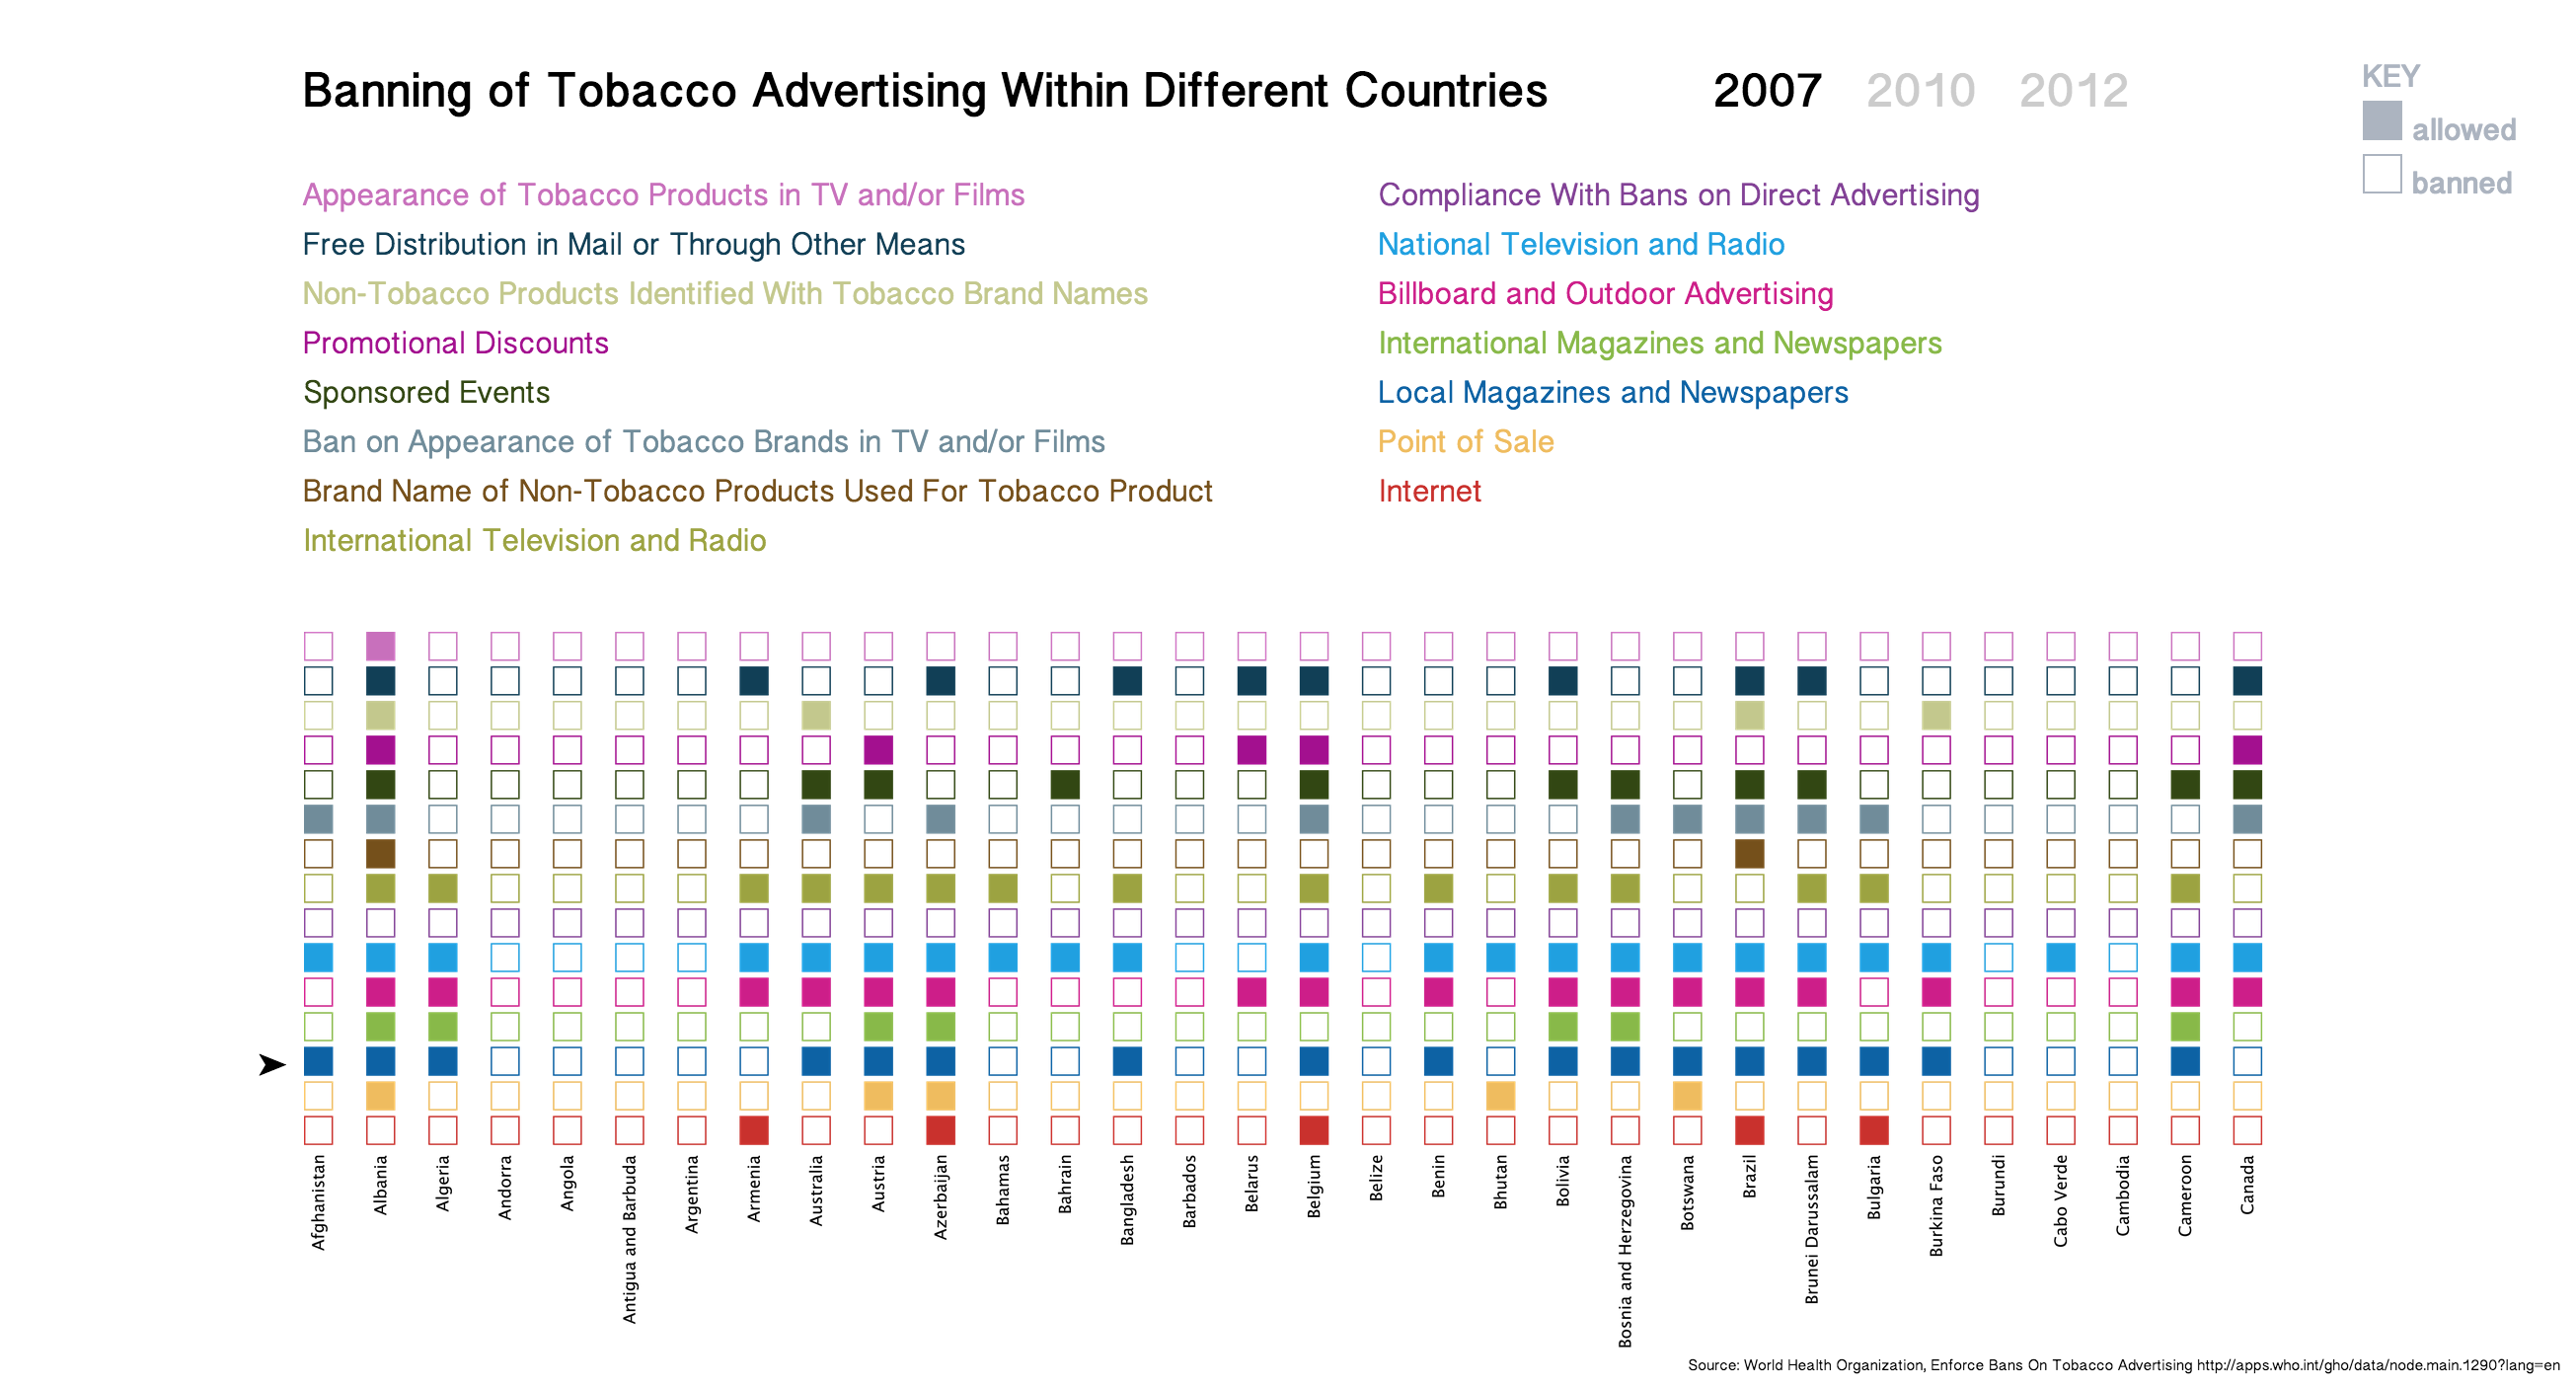
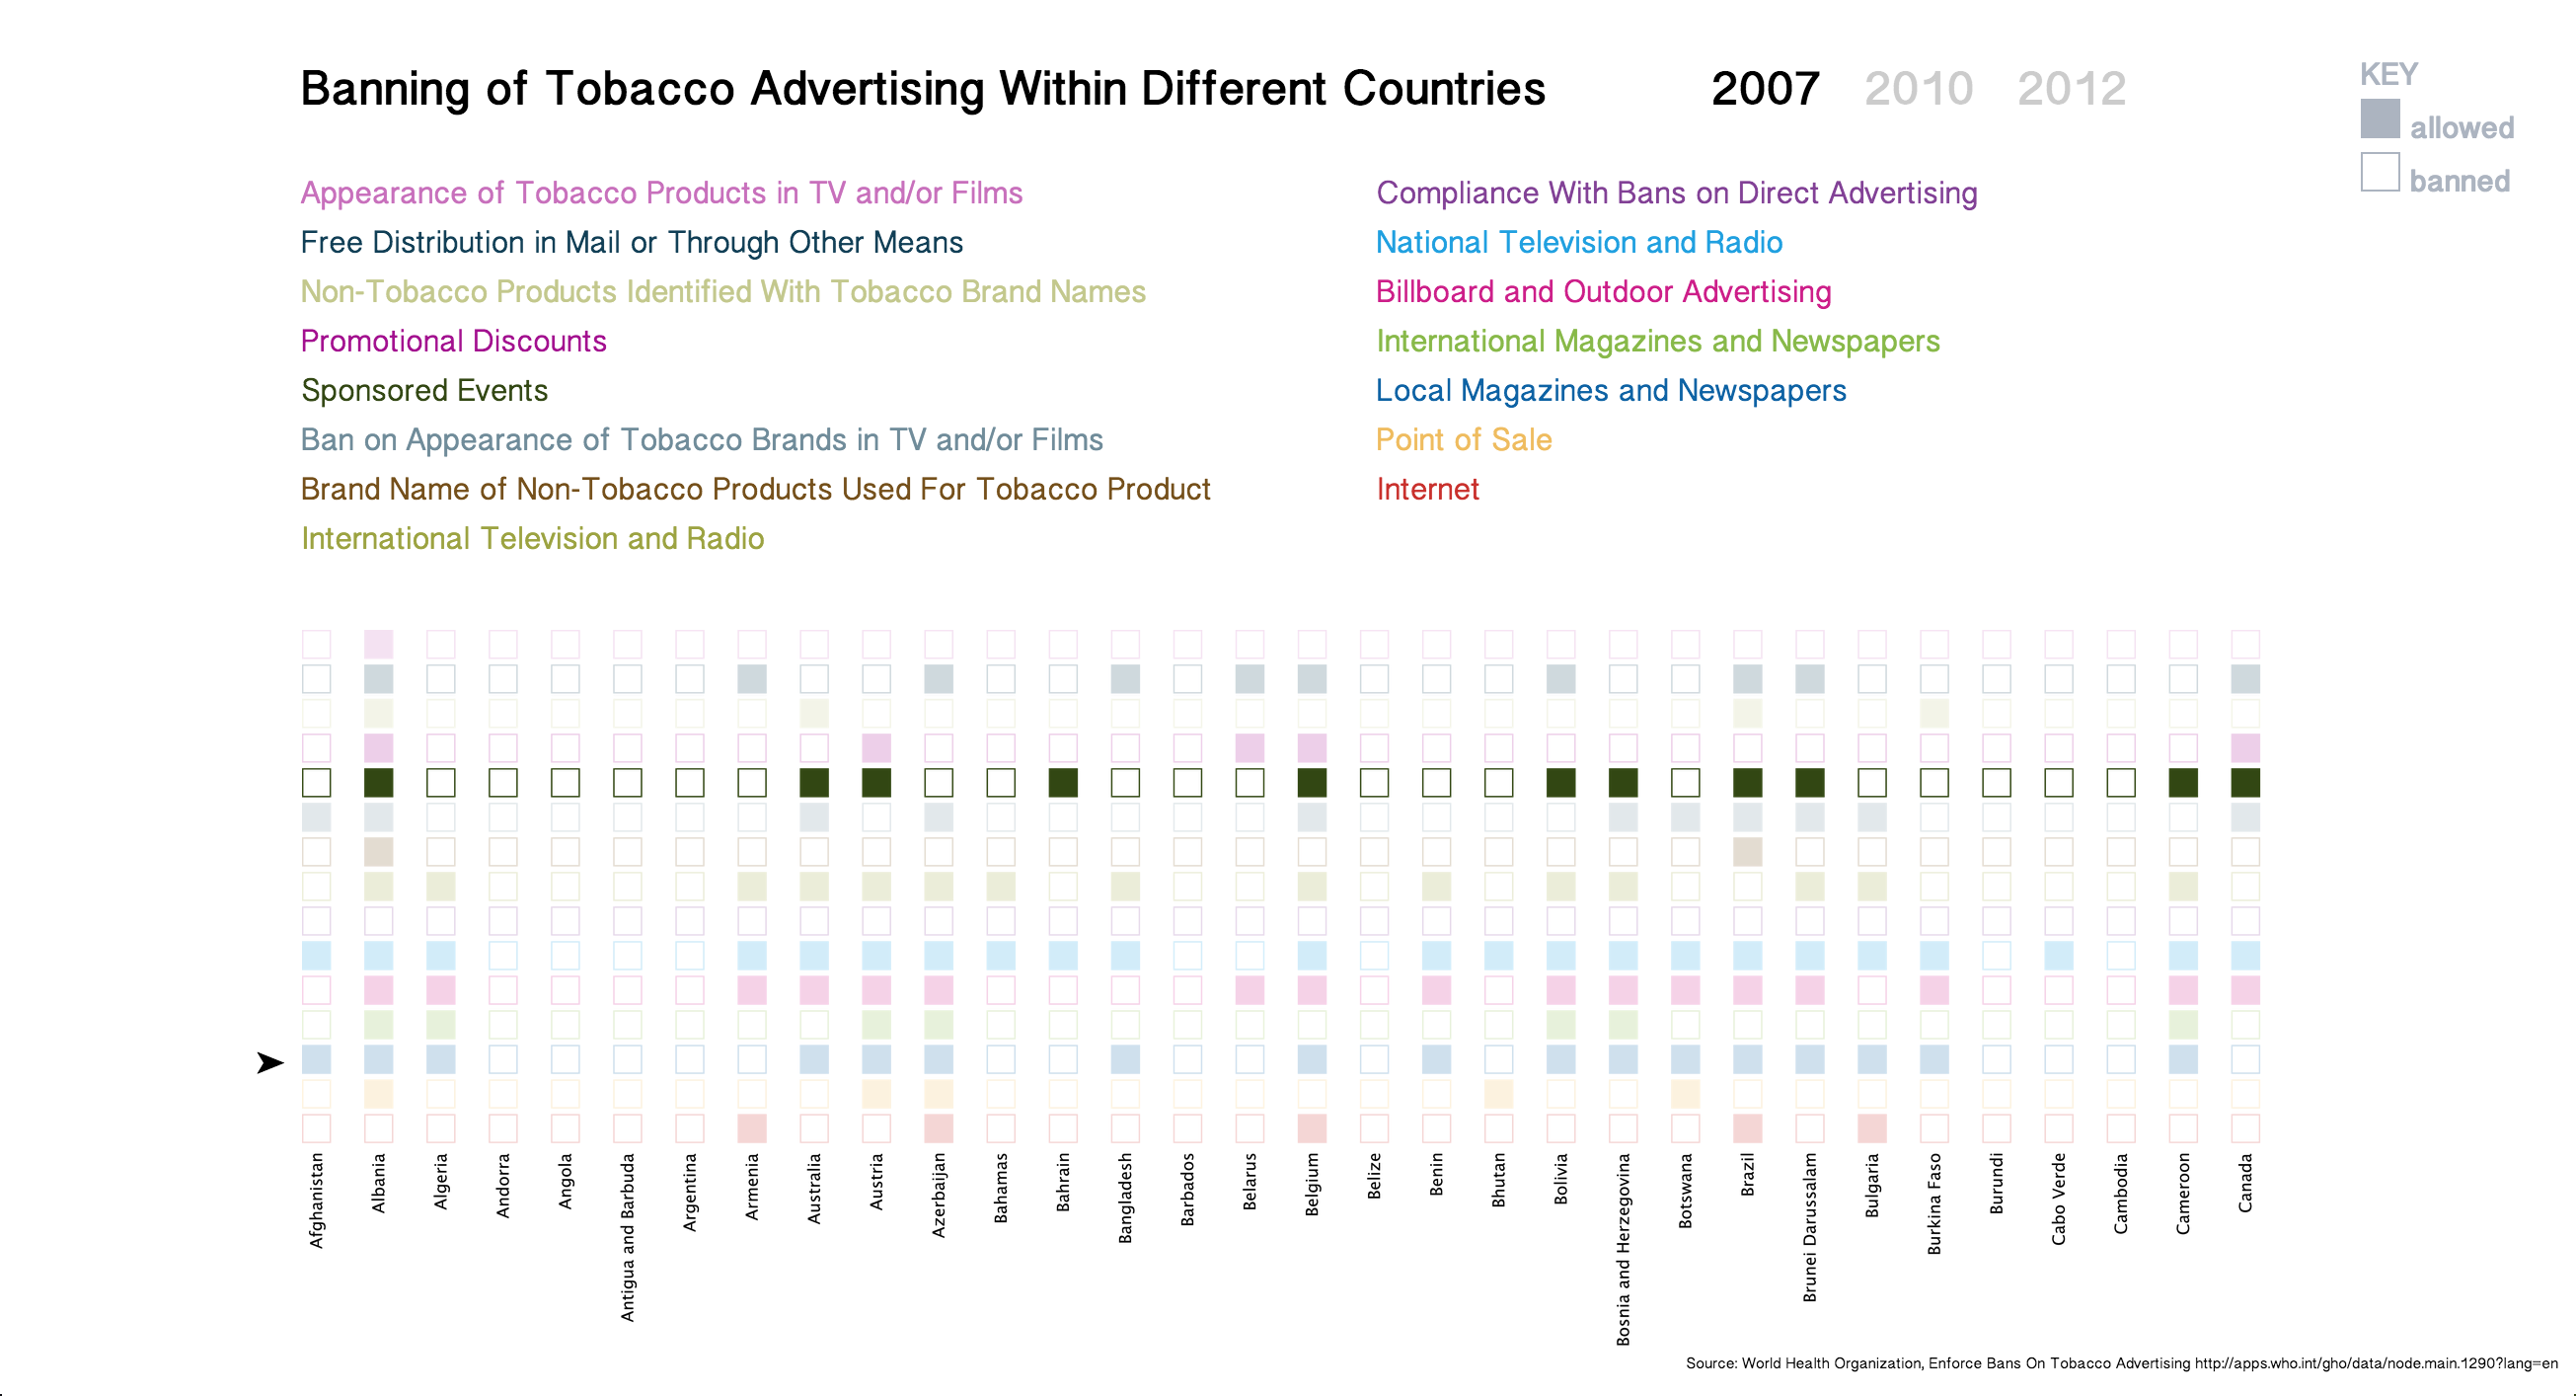
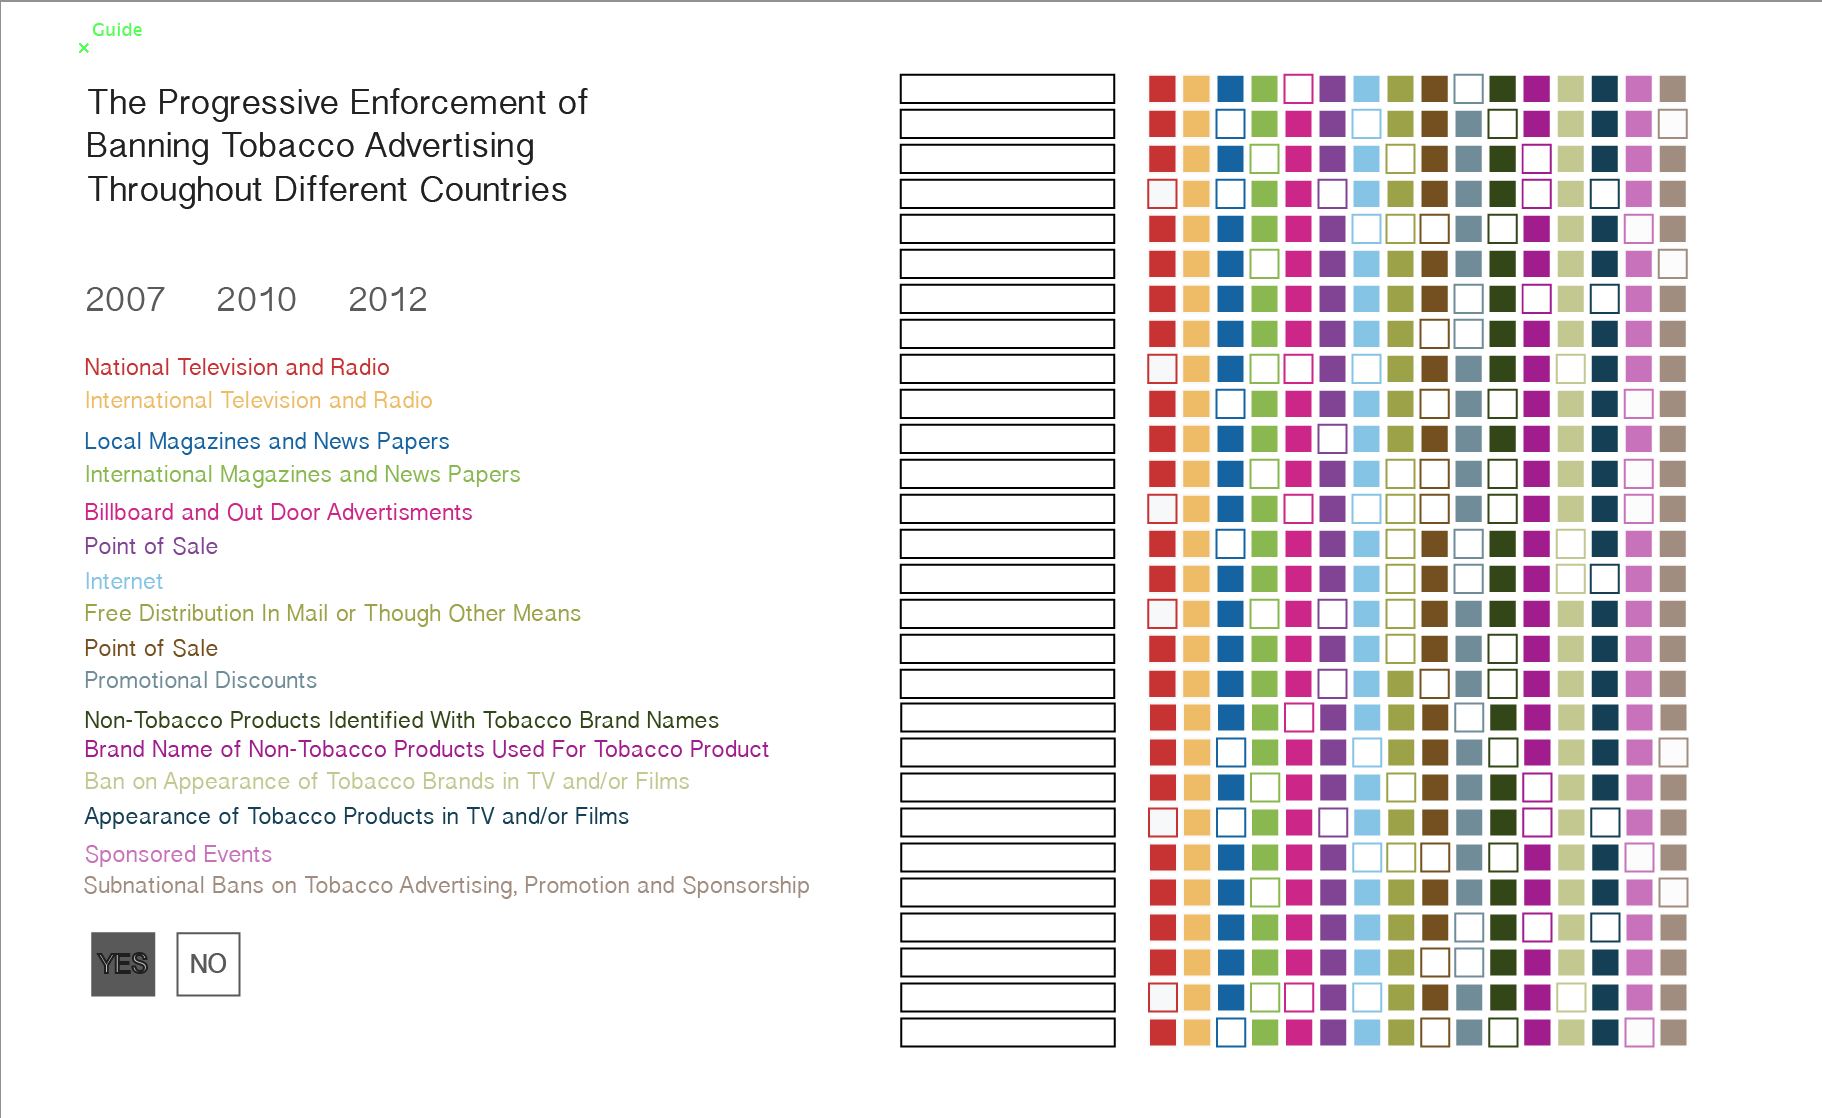
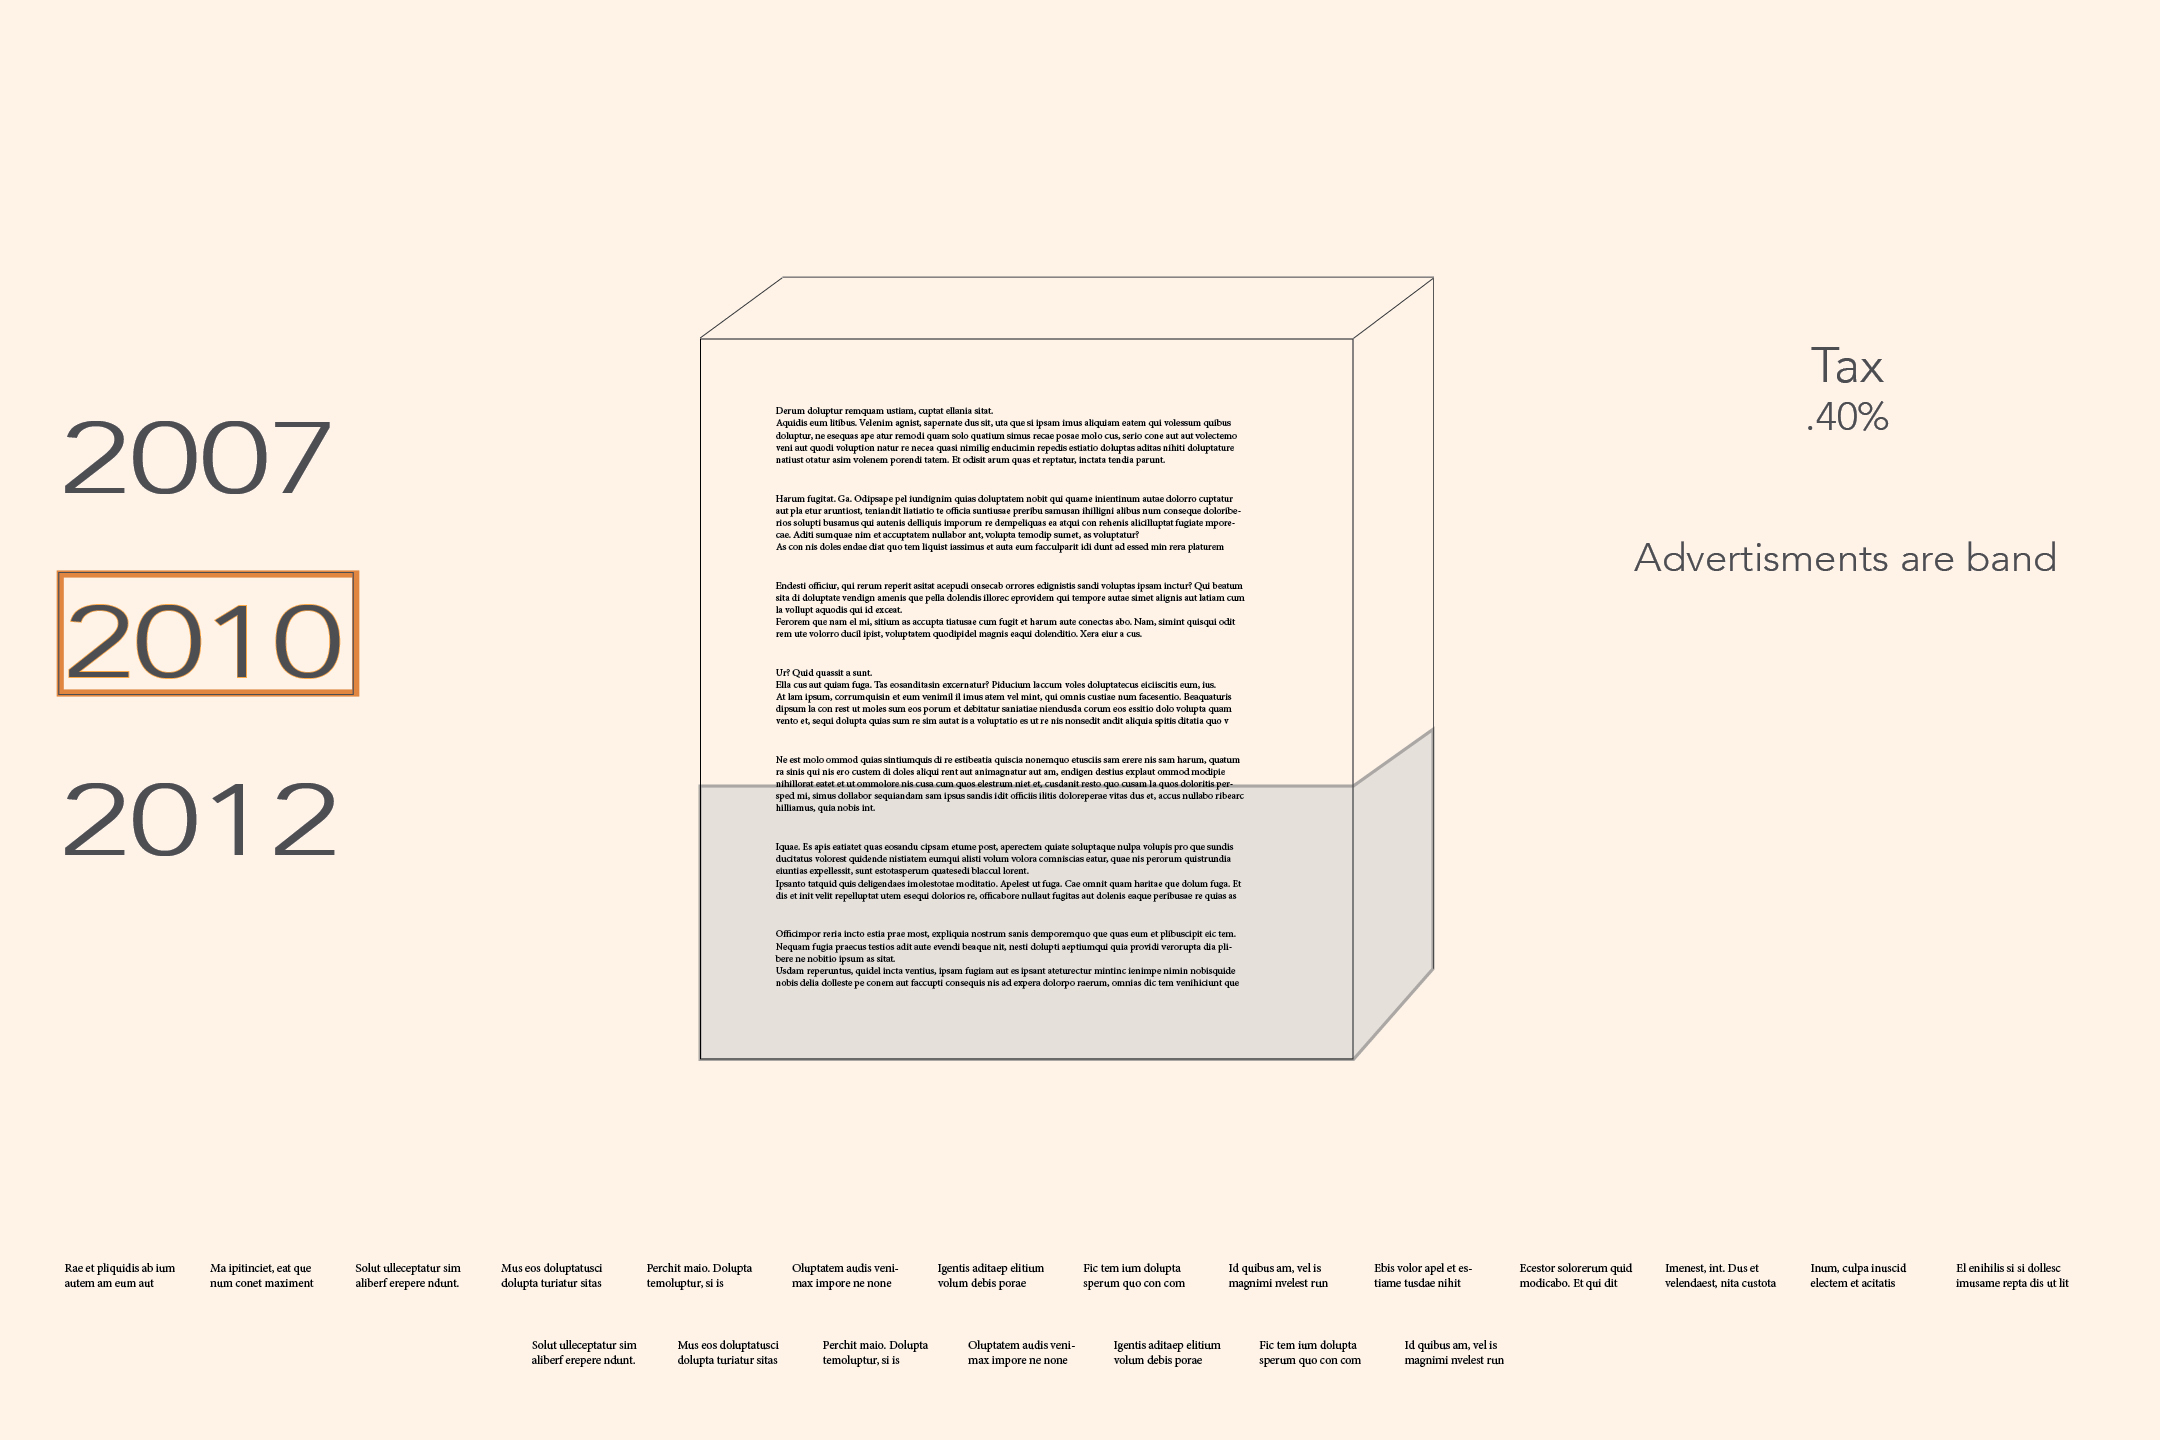
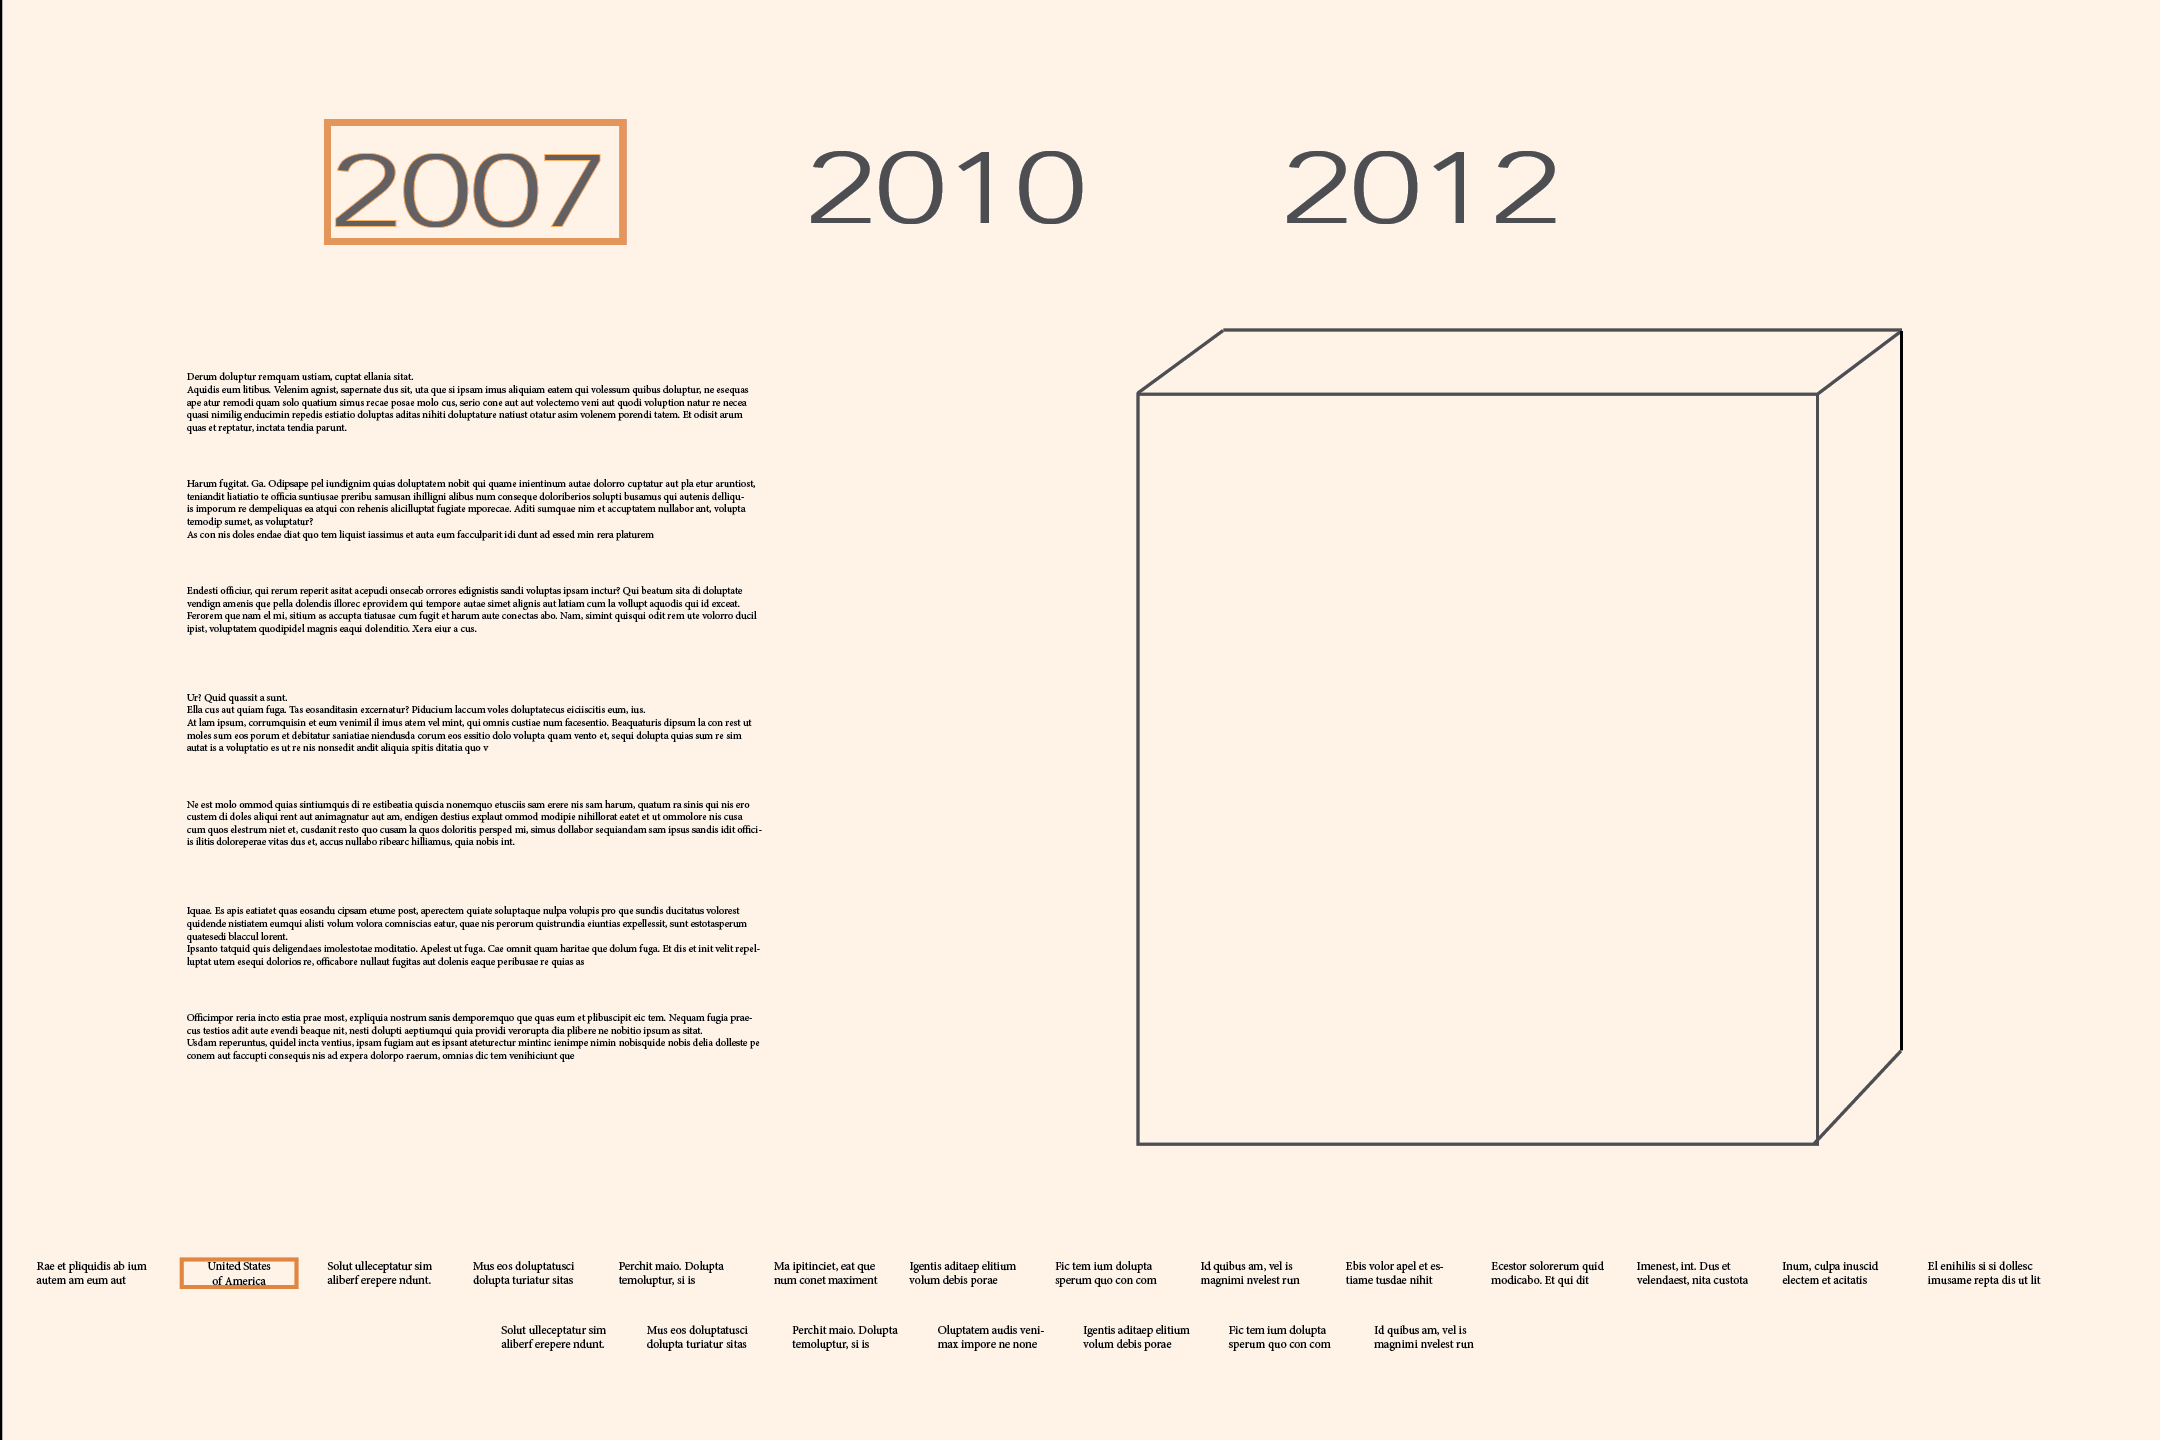
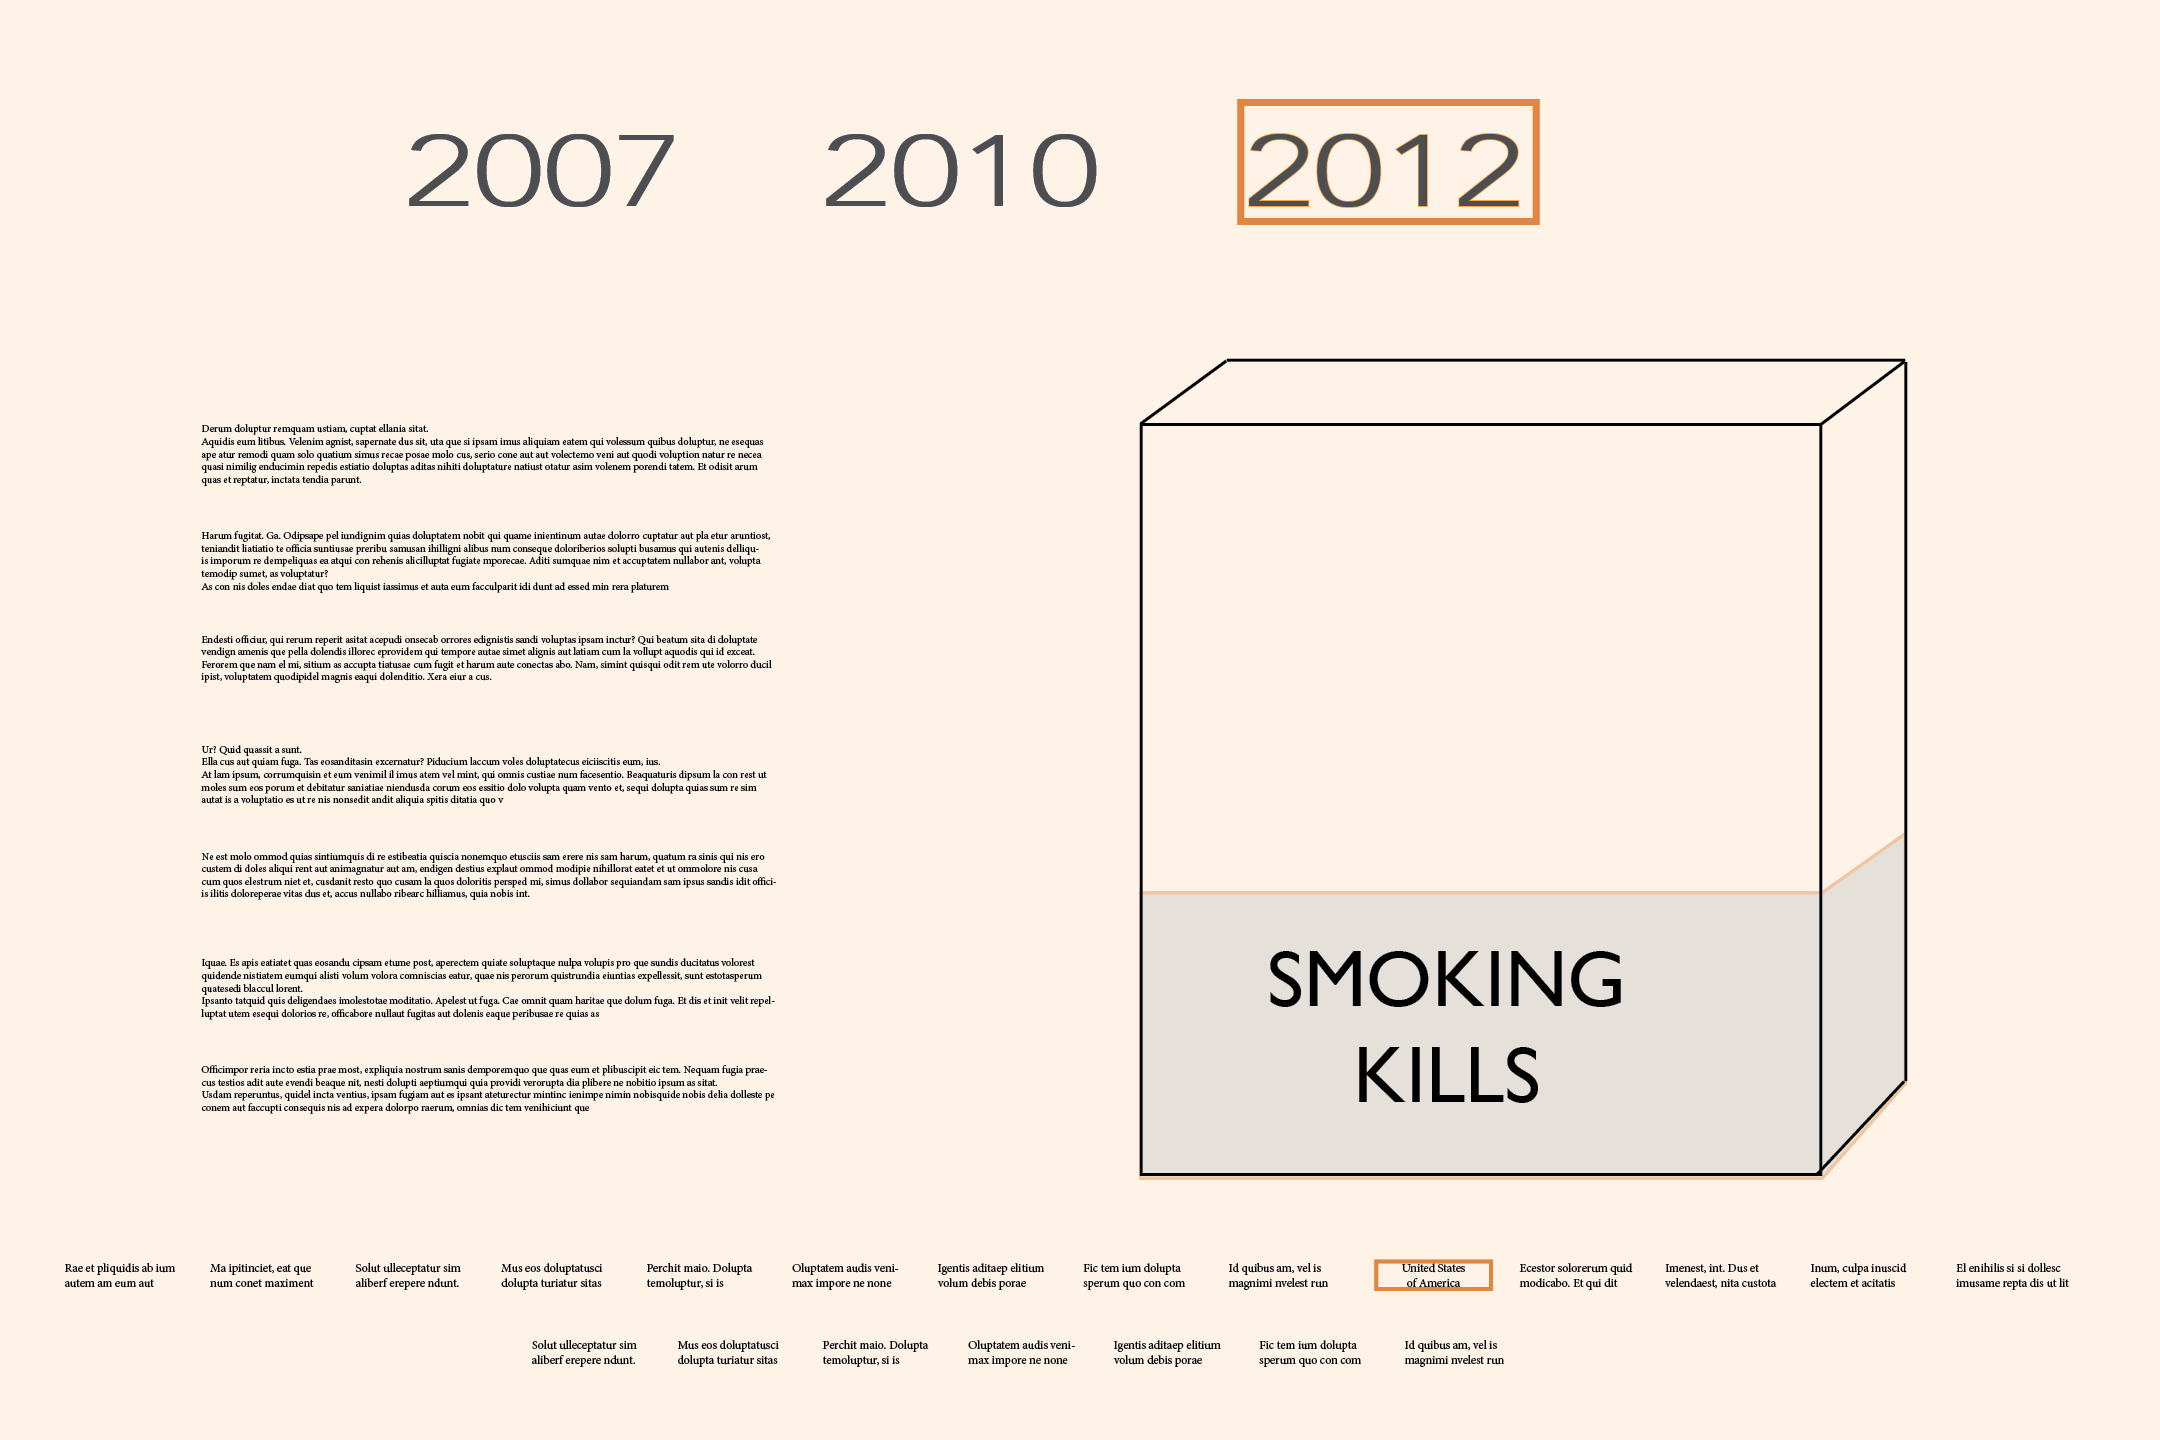
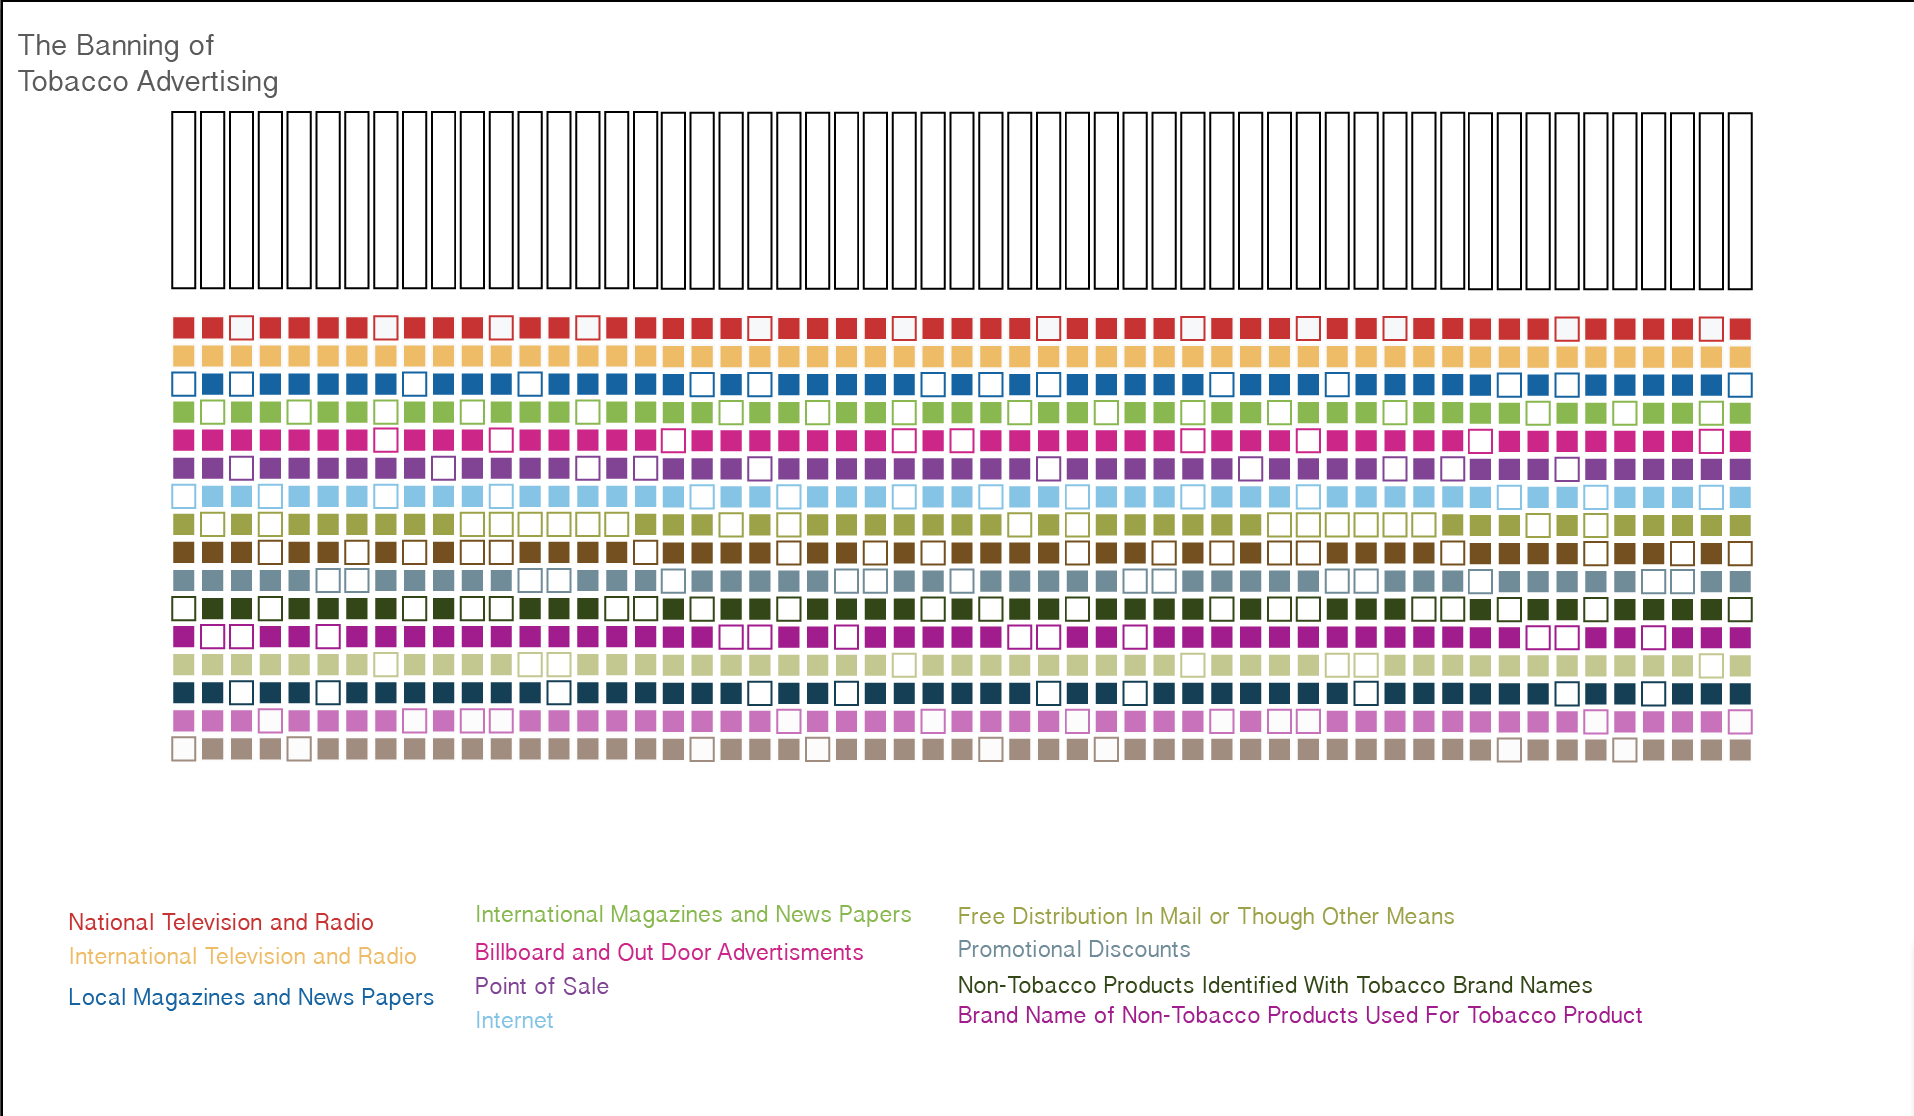
My project allows one to discover the progressive tobacco banning  in multiple countries from 2007, 2010, and 2012.


file:///Users/ariellasaragossi/Desktop/Data%20Design%20Web/project2/FINAL_PROJECT.html
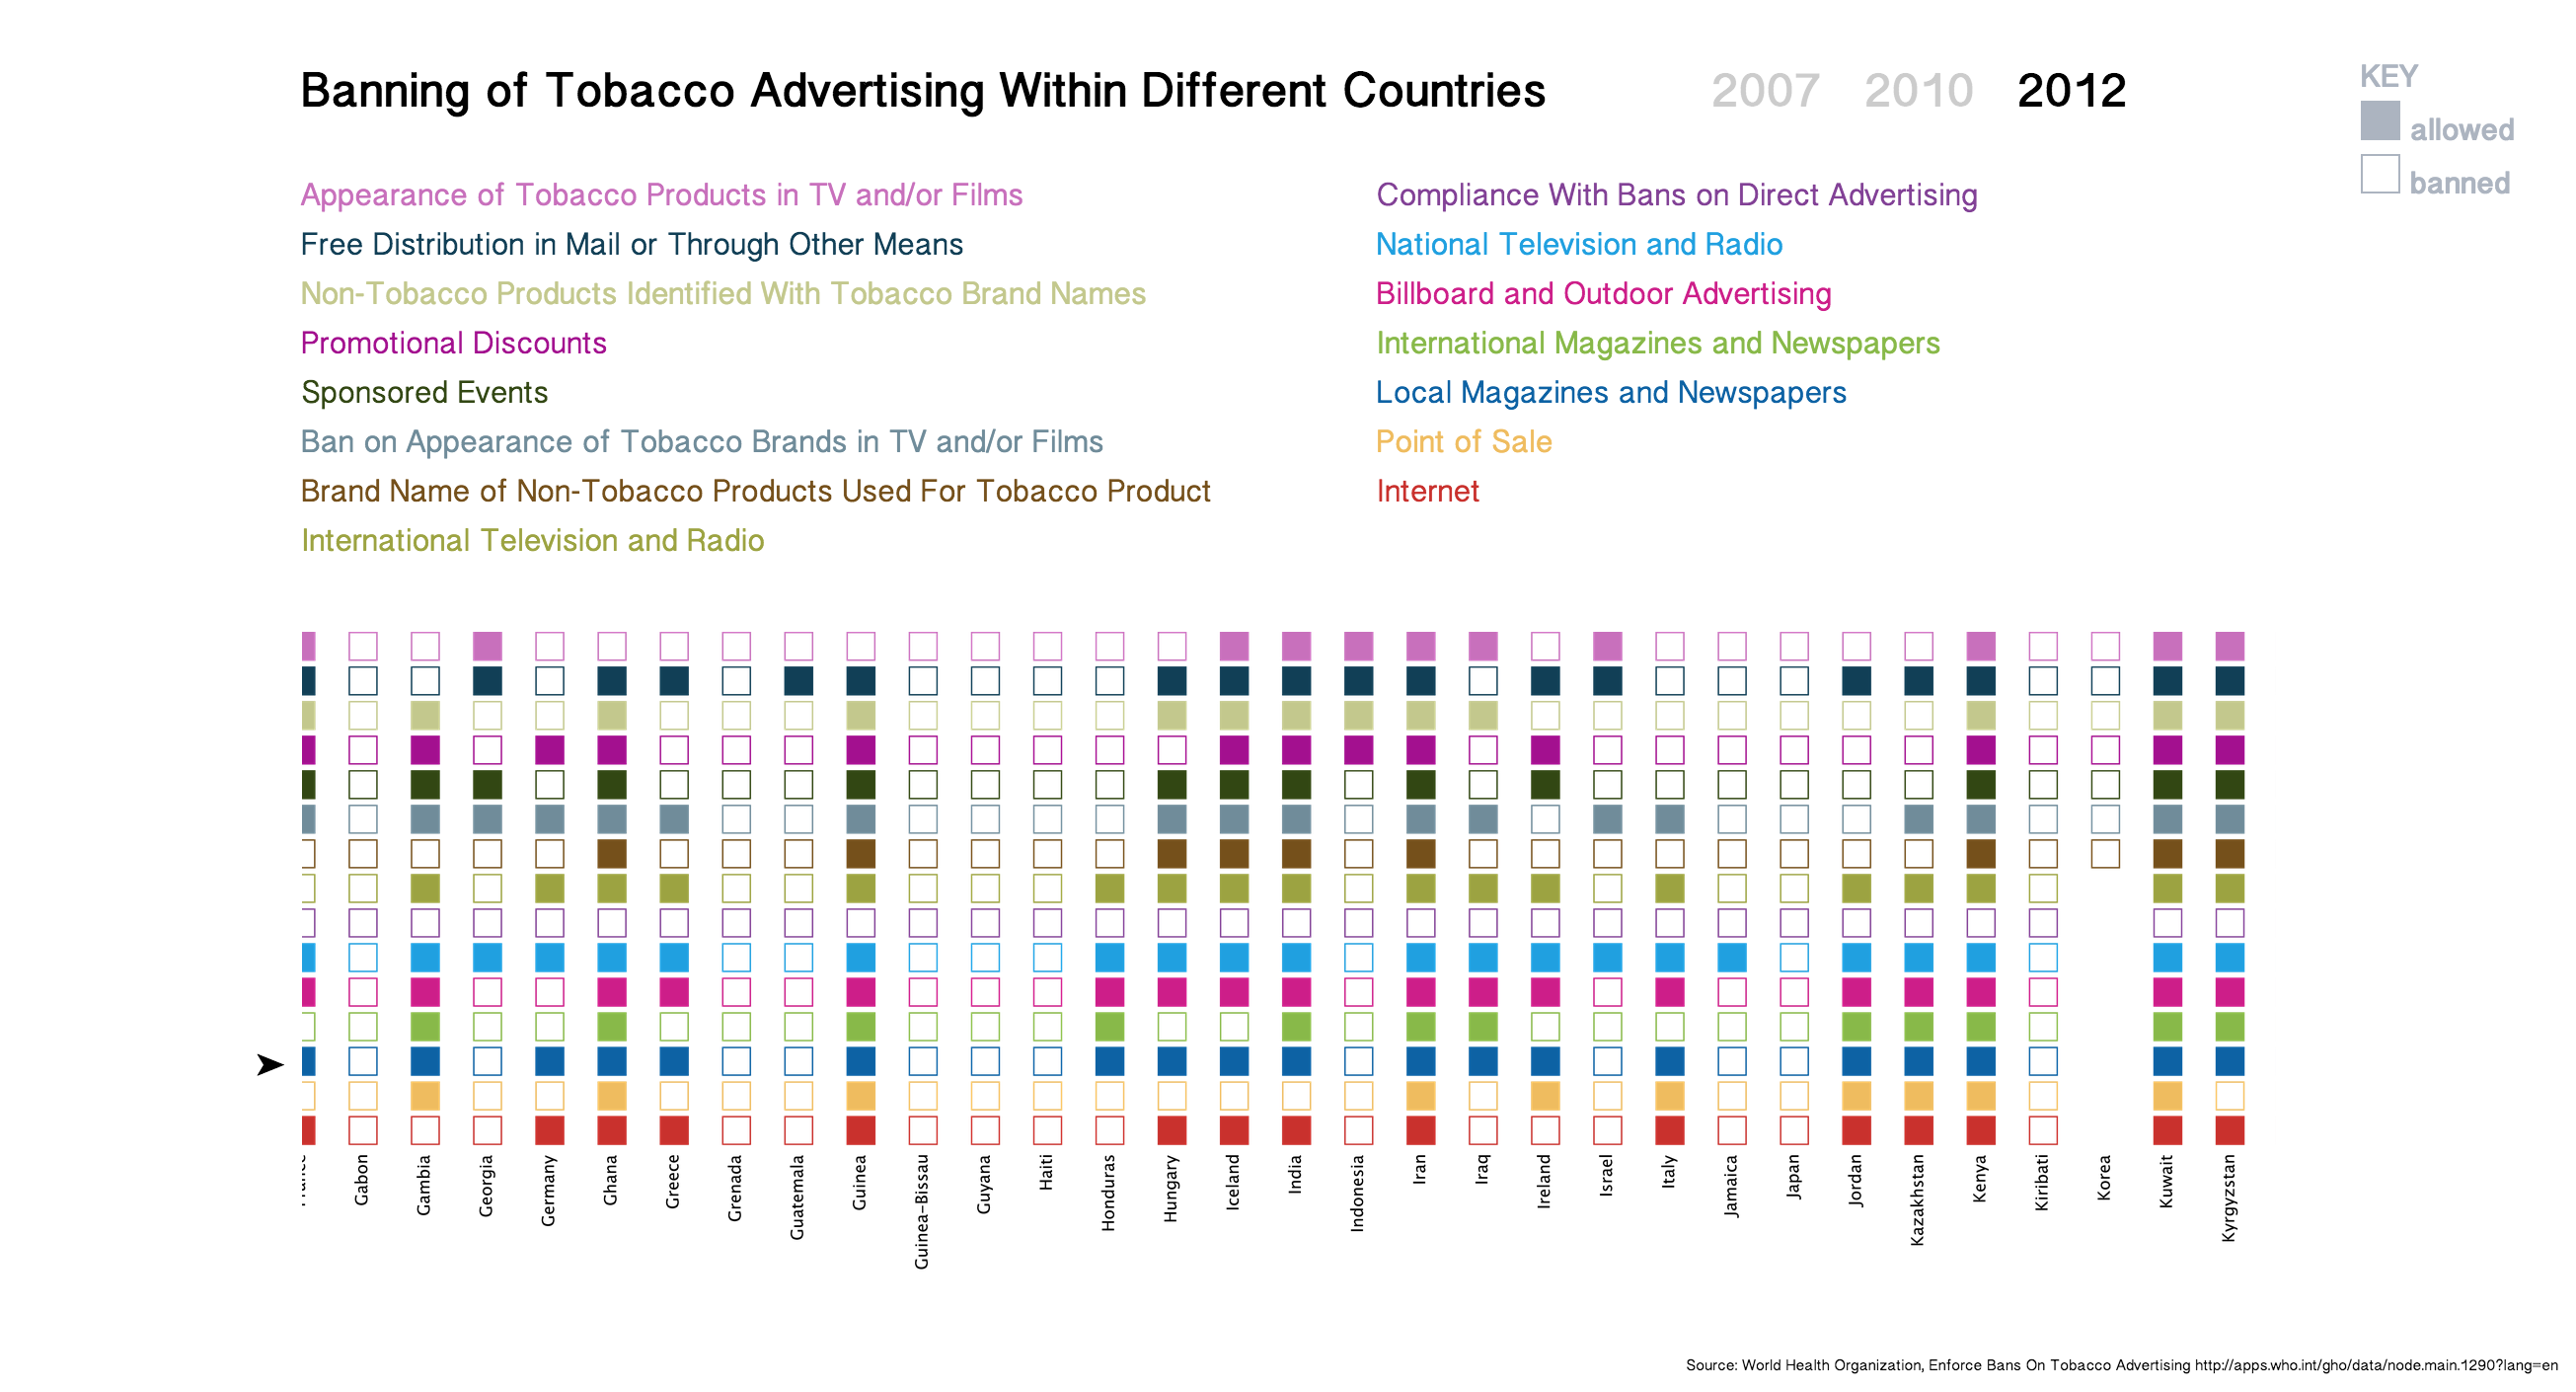
Screen Shot 2014-12-15 at 6.41.18 PM Screen Shot 2014-12-15 at 6.40.58 PM Screen Shot 2014-12-15 at 6.40.50 PM Screen Shot 2014-12-15 at 6.40.25 PM Screen Shot 2014-12-15 at 6.40.36 PM


CODE:  Processing, HTML, CSS, and JavaScript 

Processing:

import processing.pdf.*;
PFont font;
//colors
color red = color(201,49,45);
color yellow = color(239,188,95);
color blue = color(13,98,164);
color green = color(136,185,73);
color pink = color(205,30,137);
color purple = color(130,65,150);
color Lightblue = color(132,195,232);
color Lightgreen = color(156,163,65);
color brown= color(117,80,27);
color Mblue = color(112,140,154);
color Darkgreen = color(50,71,19);
color berry= color(163,16,143);
color yellowgreen = color(195,200,141);
color Skyblue = color(17,63,86);
color Lightpurple = color(200,112,188);
color Lightbrown = color(161,141,126);
void setup(){
noLoop();
size(700, 10000);
background(255);
font = loadFont(“MalayalamSangamMN-48.vlw”);
textFont(font, 17);
textAlign(RIGHT);

}

int count = 0;
int newCount = 0;
String indicator;
String answer;
String country;
String year;

void draw(){
beginRecord(PDF, “2012.pdf”);
Table boxes = loadTable ( “country.csv”, “header”);

String lastCountry = “”;

for(TableRow row : boxes.rows() ){
country = row.getString(“Country”);
indicator = row.getString(“Indicator”);
answer = row.getString(“Display Value”);
year = row.getString(“Year”);

if (!country.equals(lastCountry)) {

// println(country);
newCount++;
fill(0);
text(country, 190, (newCount*45)+13);

lastCountry = country;
}

drawSquare(newCount);

// drawBox(“Internet”, “2007”, 200, red);
// drawBox(“Point of sale”, “2007”, 225, blue);
// drawBox(“Local magazines and newspapers”, “2007”, 250, green);
}

endRecord();
}
String thisYear = “2012”;

void drawSquare(int count){
int xPos = 0;
color thisColour = color(255, 0);

if(indicator.equals(“Internet”) && year.equals(thisYear)){
thisColour = red;
xPos = 200;
}
if(indicator.equals(“Point of sale”) && year.equals(thisYear)){
thisColour = yellow;
xPos = 225;
}
if(indicator.equals(“Local magazines and newspapers”) && year.equals(thisYear)){
thisColour = blue;
xPos = 250;
}
if(indicator.equals(“International magazines and newspapers”) && year.equals(thisYear)){
thisColour = green;
xPos = 275;
}
if(indicator.equals(“Billboard and outdoor advertising”) && year.equals(thisYear)){
thisColour = pink;
xPos = 300;
}
if(indicator.equals(“National television and radio”) && year.equals(thisYear)){
thisColour = purple;
xPos = 325;
}
if(indicator.equals(“Compliance with bans on direct advertising”) && year.equals(thisYear)){
thisColour = Lightblue;
xPos = 350;
}
if(indicator.equals(“International television and radio”) && year.equals(thisYear)){
thisColour = Lightgreen;
xPos = 375;
}
if(indicator.equals(“Brand name of non-tobacco products used for tobacco product”) && year.equals(thisYear)){
thisColour = brown;
xPos = 400;
}
if(indicator.equals(“Ban on appearance of tobacco brands in TV and/or films (product placement)”) && year.equals(thisYear)){
thisColour = Mblue;
xPos = 425;
}
if(indicator.equals(“Sponsored events”) && year.equals(thisYear)){
thisColour = Darkgreen;
xPos = 450;
}
if(indicator.equals(“Promotional discounts”) && year.equals(thisYear)){
thisColour = berry;
xPos = 475;
}
if(indicator.equals(“Non-tobacco products identified with tobacco brand names”) && year.equals(thisYear)){
thisColour = yellowgreen;
xPos = 500;
}
if(indicator.equals(“Free distribution in mail or through other means”) && year.equals(thisYear)){
thisColour = Skyblue;
xPos = 525;
}
if(indicator.equals(“Appearance of tobacco products in TV and/or films”) && year.equals(thisYear)){
thisColour = Lightpurple;
xPos = 550;
}

if(answer.equals(“Yes”)){
fill(255, 0, 0, 0);
}else{
fill(thisColour);
}
stroke(thisColour);
rect(xPos, count*45, 20, 20);

}


PFont font;
//colors
color red = color(201,49,45);
color yellow = color(239,188,95);
color blue = color(13,98,164);
color green = color(136,185,73);
color pink = color(205,30,137);
color purple = color(130,65,150);
color Lightblue = color(132,195,232);
color Lightgreen = color(156,163,65);
color brown= color(117,80,27);
color Mblue = color(112,140,154);
color Darkgreen = color(50,71,19);
color berry= color(163,16,143);
color yellowgreen = color(195,200,141);
color Skyblue = color(17,63,86);
color Lightpurple = color(200,112,188);
color Lightbrown = color(161,141,126);
void setup(){
noLoop();
size(700, 10000);
background(255);
font = loadFont(“MalayalamSangamMN-48.vlw”);
textFont(font, 17);
textAlign(RIGHT);

}

int count = 0;
int newCount = 0;
String indicator;
String answer;
String country;
String year;

void draw(){
beginRecord(PDF, “2012.pdf”);
Table boxes = loadTable ( “country.csv”, “header”);

String lastCountry = “”;

for(TableRow row : boxes.rows() ){
country = row.getString(“Country”);
indicator = row.getString(“Indicator”);
answer = row.getString(“Display Value”);
year = row.getString(“Year”);

if (!country.equals(lastCountry)) {

// println(country);
newCount++;
fill(0);
text(country, 190, (newCount*45)+13);

lastCountry = country;
}

drawSquare(newCount);

// drawBox(“Internet”, “2007”, 200, red);
// drawBox(“Point of sale”, “2007”, 225, blue);
// drawBox(“Local magazines and newspapers”, “2007”, 250, green);
}

endRecord();
}
String thisYear = “2012”;

void drawSquare(int count){
int xPos = 0;
color thisColour = color(255, 0);

if(indicator.equals(“Internet”) && year.equals(thisYear)){
thisColour = red;
xPos = 200;
}
if(indicator.equals(“Point of sale”) && year.equals(thisYear)){
thisColour = yellow;
xPos = 225;
}
if(indicator.equals(“Local magazines and newspapers”) && year.equals(thisYear)){
thisColour = blue;
xPos = 250;
}
if(indicator.equals(“International magazines and newspapers”) && year.equals(thisYear)){
thisColour = green;
xPos = 275;
}
if(indicator.equals(“Billboard and outdoor advertising”) && year.equals(thisYear)){
thisColour = pink;
xPos = 300;
}
if(indicator.equals(“National television and radio”) && year.equals(thisYear)){
thisColour = purple;
xPos = 325;
}
if(indicator.equals(“Compliance with bans on direct advertising”) && year.equals(thisYear)){
thisColour = Lightblue;
xPos = 350;
}
if(indicator.equals(“International television and radio”) && year.equals(thisYear)){
thisColour = Lightgreen;
xPos = 375;
}
if(indicator.equals(“Brand name of non-tobacco products used for tobacco product”) && year.equals(thisYear)){
thisColour = brown;
xPos = 400;
}
if(indicator.equals(“Ban on appearance of tobacco brands in TV and/or films (product placement)”) && year.equals(thisYear)){
thisColour = Mblue;
xPos = 425;
}
if(indicator.equals(“Sponsored events”) && year.equals(thisYear)){
thisColour = Darkgreen;
xPos = 450;
}
if(indicator.equals(“Promotional discounts”) && year.equals(thisYear)){
thisColour = berry;
xPos = 475;
}
if(indicator.equals(“Non-tobacco products identified with tobacco brand names”) && year.equals(thisYear)){
thisColour = yellowgreen;
xPos = 500;
}
if(indicator.equals(“Free distribution in mail or through other means”) && year.equals(thisYear)){
thisColour = Skyblue;
xPos = 525;
}
if(indicator.equals(“Appearance of tobacco products in TV and/or films”) && year.equals(thisYear)){
thisColour = Lightpurple;
xPos = 550;
}

if(answer.equals(“Yes”)){
fill(255, 0, 0, 0);
}else{
fill(thisColour);
}
stroke(thisColour);
rect(xPos, count*45, 20, 20);

}


HTML: 

<div class=”category compliance_with_bans” id=”Compliance_with_bans_on_direct_advertising”>
<p> Compliance With Bans on Direct Advertising</p>

</div>

<div class=”category national_television_and_radio” id=”National_television_and_radio”>
<p> National Television and Radio</p>

</div>

<div class=”category billboard_and_outdoor_ads” id=”Billboard_and_outdoor_advertising”>
<p> Billboard and Outdoor Advertising</p>

</div>

<div class=”category international_magazines” id=”International_magazines_and_newspapers”>
<p> International Magazines and Newspapers</p>
</div>

<div class=”category local_magazines” id=”Local_magazines_and_newspapers”>
<p> Local Magazines and Newspapers</p>

</div>

<div class=”category point_of_sale” id=”PointofSale”>
<p> Point of Sale</p>

</div>

<div class=”category internet” id=”Internet”>
<p> Internet</p>
</div>

</div> <!– end column 2 –>

</div> <!– end centerThis –>

<div id=”imageBox”>
<img id=”image2007″ src=”2007.png”>
<img id=”image2010″ src=”2010.png”>
<img id=”image2012″ src=”2012.png”>
</div>
<p id= “arrow”>➤</p>

<div id=”fade”>
<div class=”apperance_tobacco” id=”apperance_tobacco”></div>
<div class=”free_distri” id=”free_distri”></div>
<div class=”non_tobacco_products” id=”non_tobacco_products”></div>
<div class=”promotional_discounts” id=”promotional_discounts”></div>
<div class=”sponsored_events” id=”sponsored_events”></div>
<div class=”ban_on_appearances” id=”ban_on_appearances”></div>
<div class=”brand_names_of_non_tobacco” id=”brand_names_of_non_tobacco”></div>
<div class=”international_tel” id=”international_tel”></div>
<div class=”compliance_with_bans” id=”compliance_with_bans”></div>
<div class=”national_television_and_radio” id=”national_television_and_radio”></div>
<div class=”billboard_and_outdoor_ads” id=”billboard_and_outdoor_ads”></div>
<div class=”international_magazines” id=”international_magazines”></div>
<div class=”local_magazines” id=”local_magazines”></div>
<div class=”point_of_sale” id=”point_of_sale”></div>
<div class=”internet” id=”internet”></div>
</div>

<script type=”text/javascript” src=”main.js”></script>

<a id= “source” href=”http://apps.who.int/gho/data/node.main.1290?lang=en”> Source: World Health Organization, Enforce Bans On Tobacco Advertising http://apps.who.int/gho/data/node.main.1290?lang=en</a>
<div id= “boxesRef”>

<div id=”press”>KEY</div>

<div id=”legend”>
<div id=”yes”></div><p>allowed</p>
<div id=”no”></div><p>banned</p>
</div>

</div>

</body>

</html>

JavaScript: main

css : final


Comp:
Screen Shot 2014-12-15 at 6.45.13 PM Screen Shot 2014-12-15 at 6.44.51 PM


Designing a Comp – Project 2

Subject of The Poster:

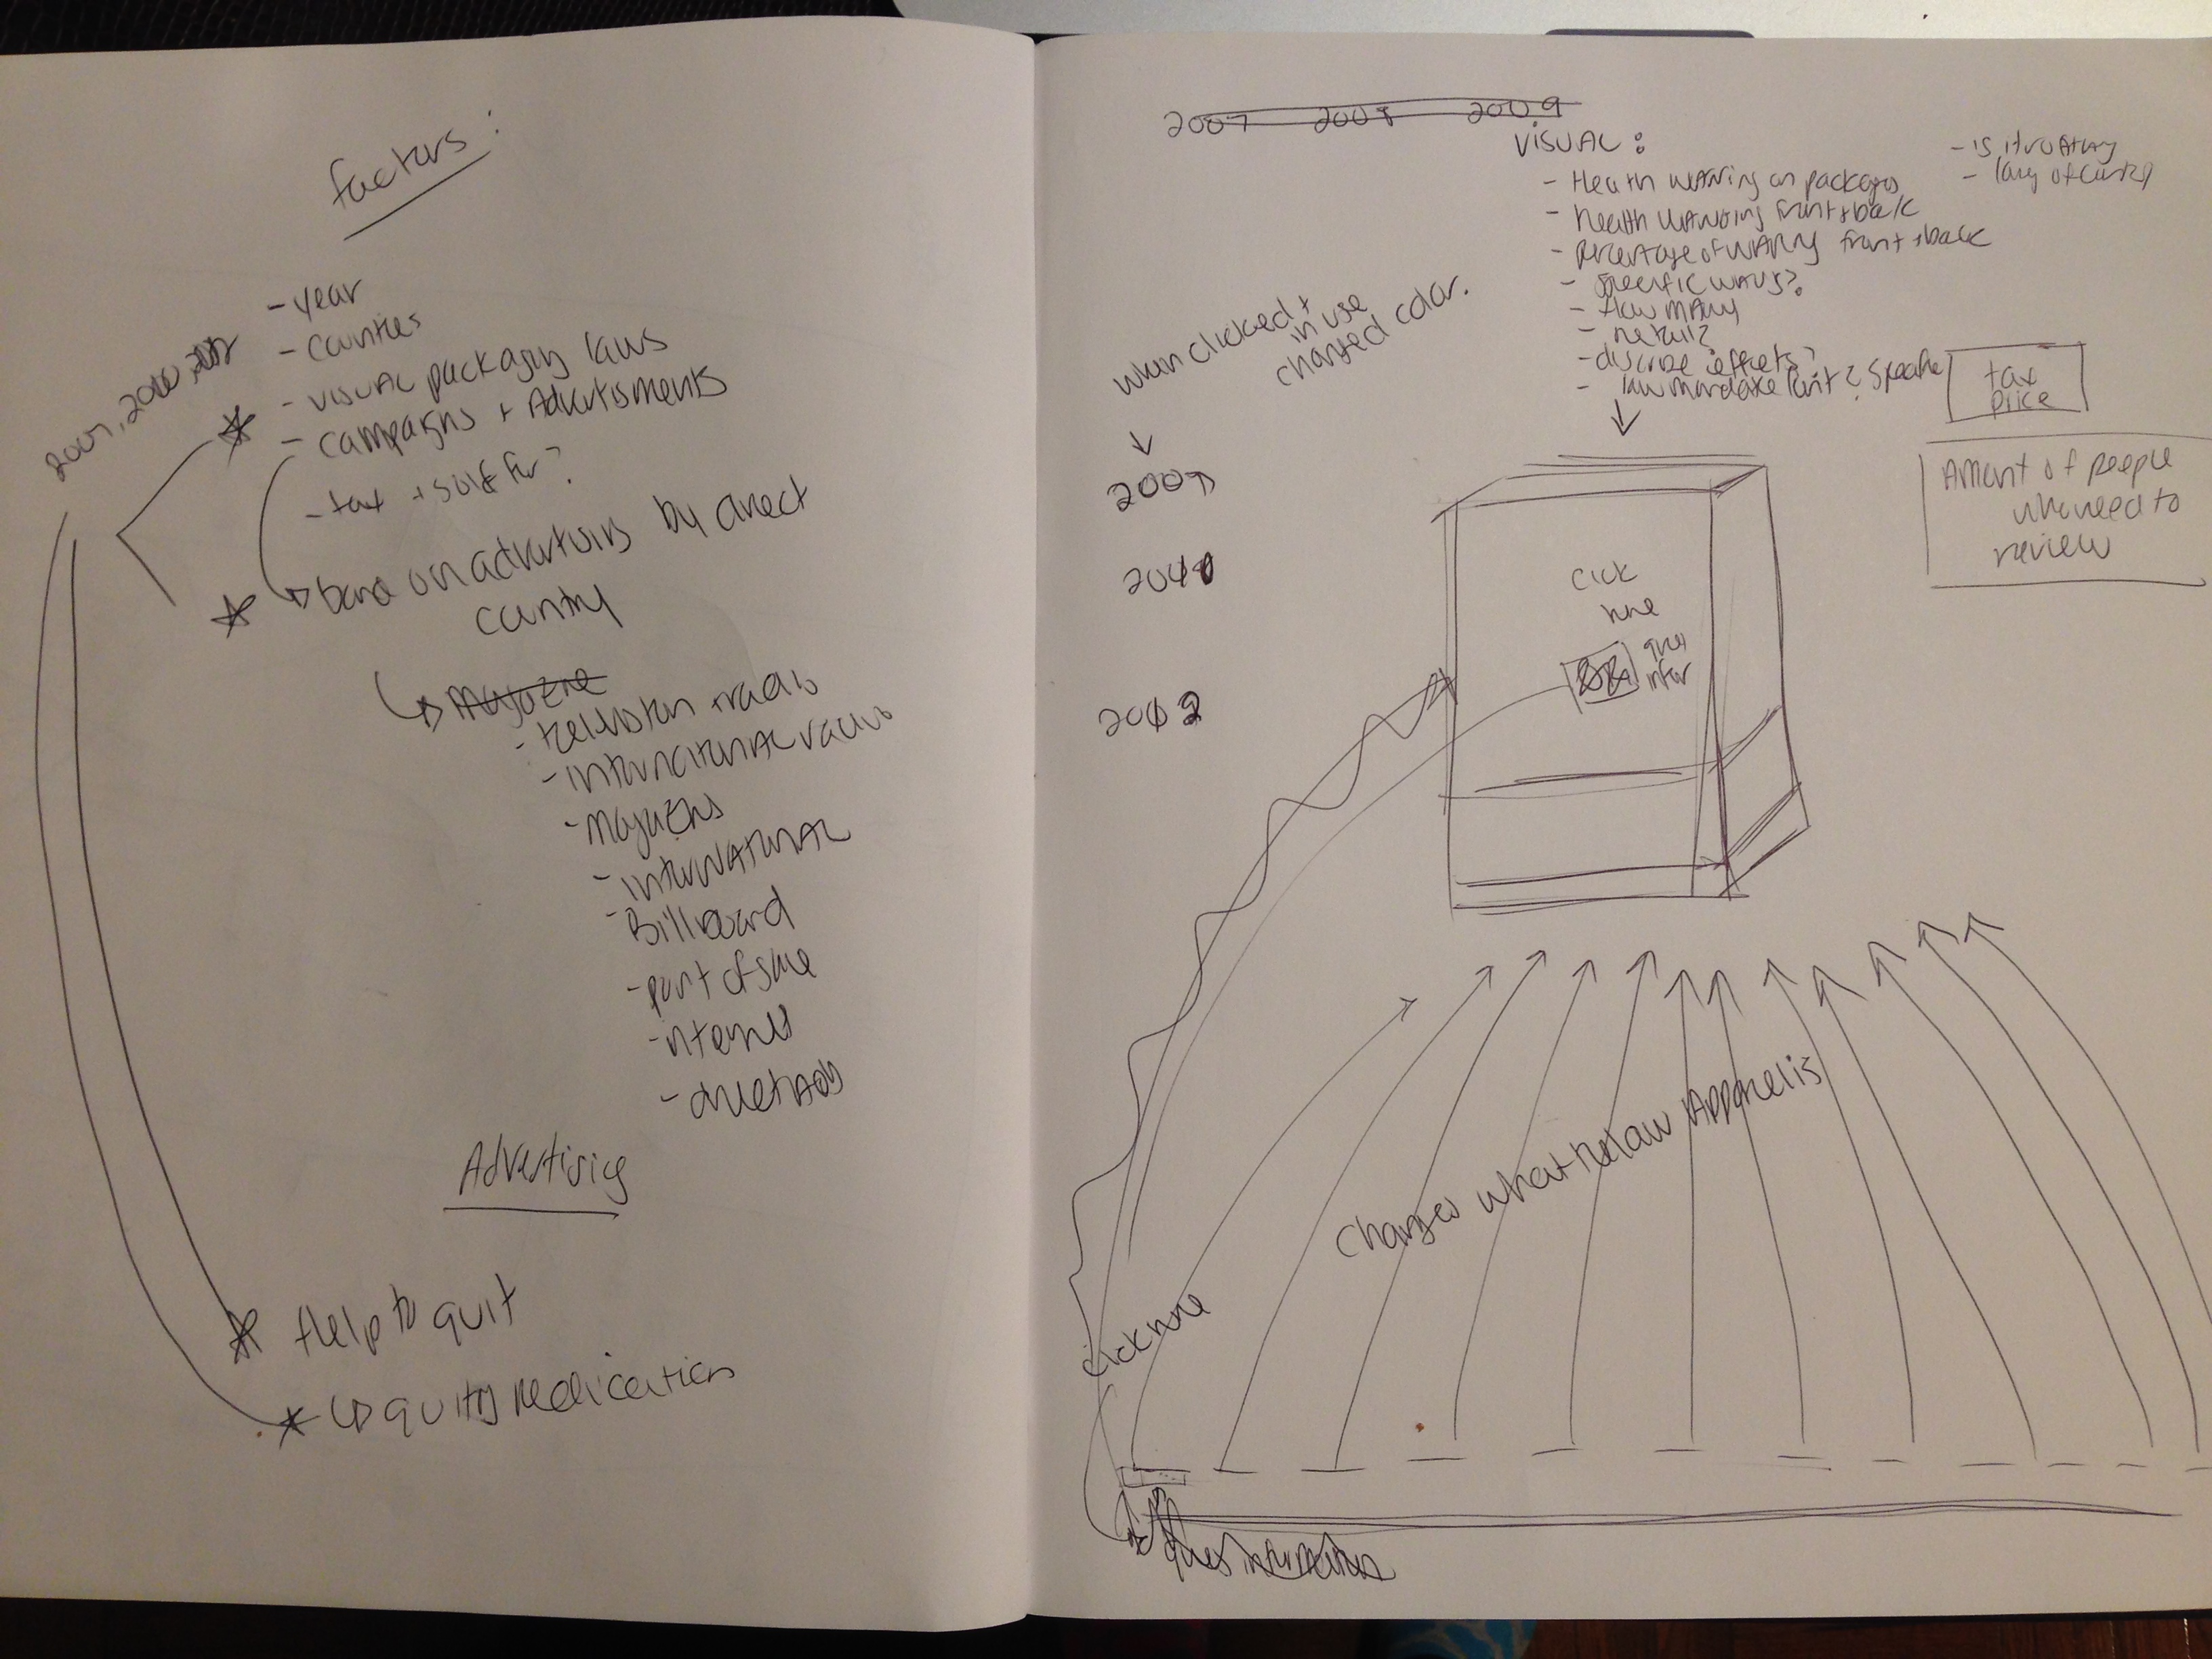
My project is an interactive information design that illustrates information regarding the laws of cigarette packaging, advertisements, and other cigarette information within different countries during the years of 2007, 2010, and 2012. Thoughout the years the laws regarding cigarette usage and presentation has become much stricter based on the server health conditions that smoking creates. My project will allow the user to click on the different years and counties allowing the user to see how the laws regarding cigarettes have changed thought the year and differ from each country.

The Data:

The data I will use is found on http://www.who.int/en/, which is the website forThe World Health Organization. This site has collected a lot of data about the laws and regulations of cigarettes within a multiple different countries during the years of 2007, 2010, 2012. The World Health Organization has a lot of interesting data in reference to this subject.

Tools and Approach:

I will download the data that I found into CSV files and import them into processing. I will organized the information into each individual country and allow all the information for the specific country to be organized in such a way that is interesting and readable. Each specific year and country the user chooses will have an outline of a box of cigarettes, in order for them to get an idea of how the laws regarding the packaging of cigarettes have became very specific and strict over the years. I will supply additional information regarding the cigarettes within that country and year in order to have a clearer understanding of the regulations for each country.

PROMP PROMP2 PROMP3


My Sketch:

IMG_4780


Documenting


SPOT THE SPOT:

Description and Objective:

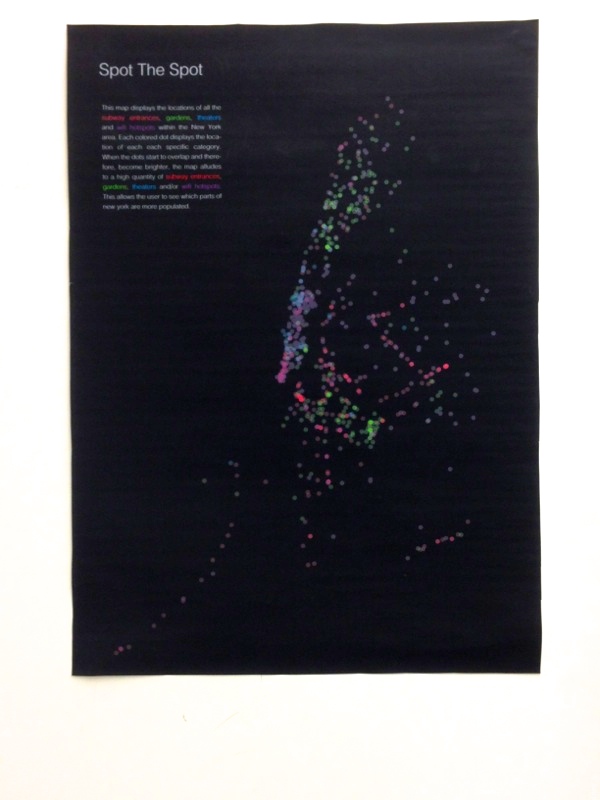
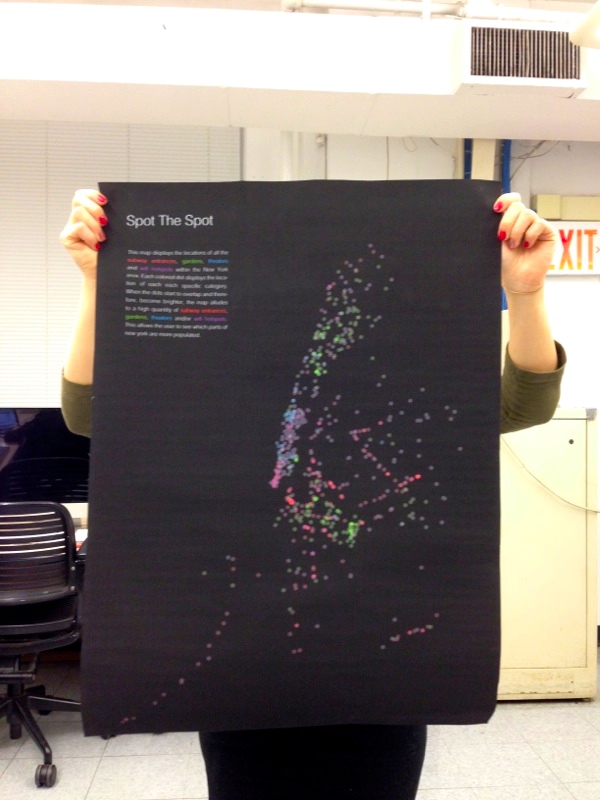
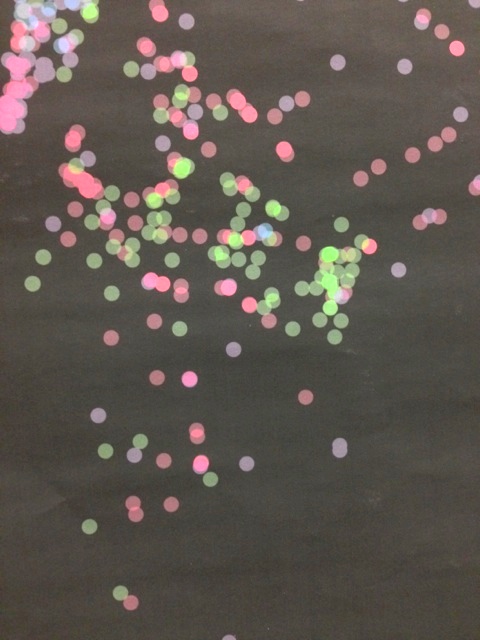
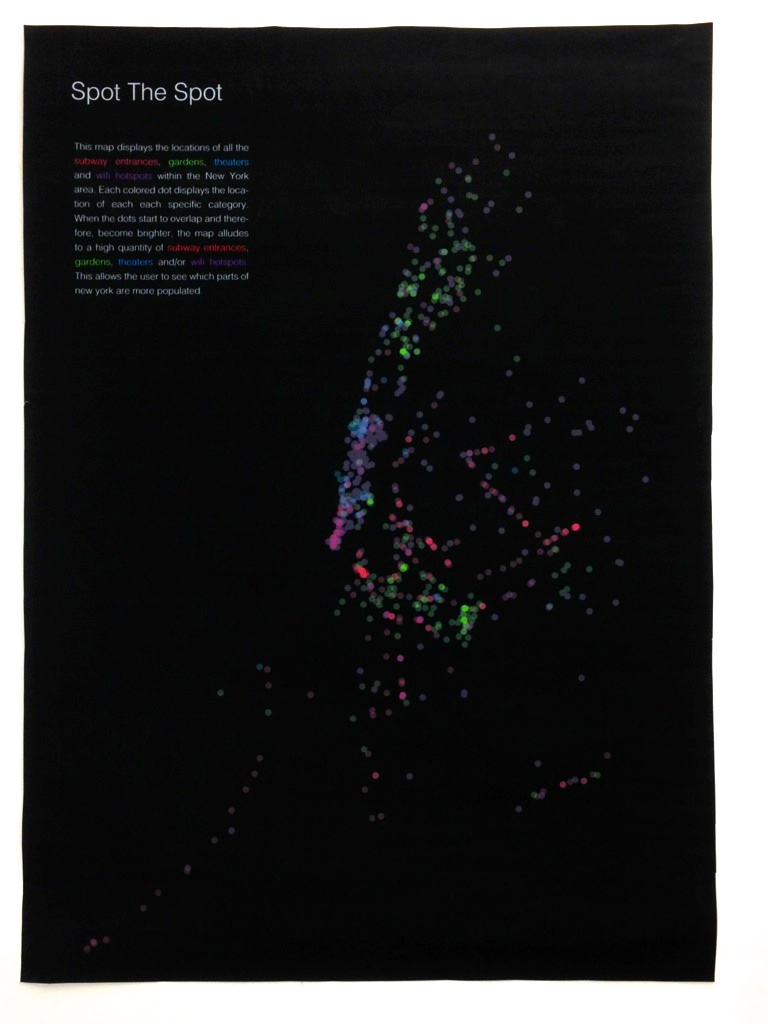
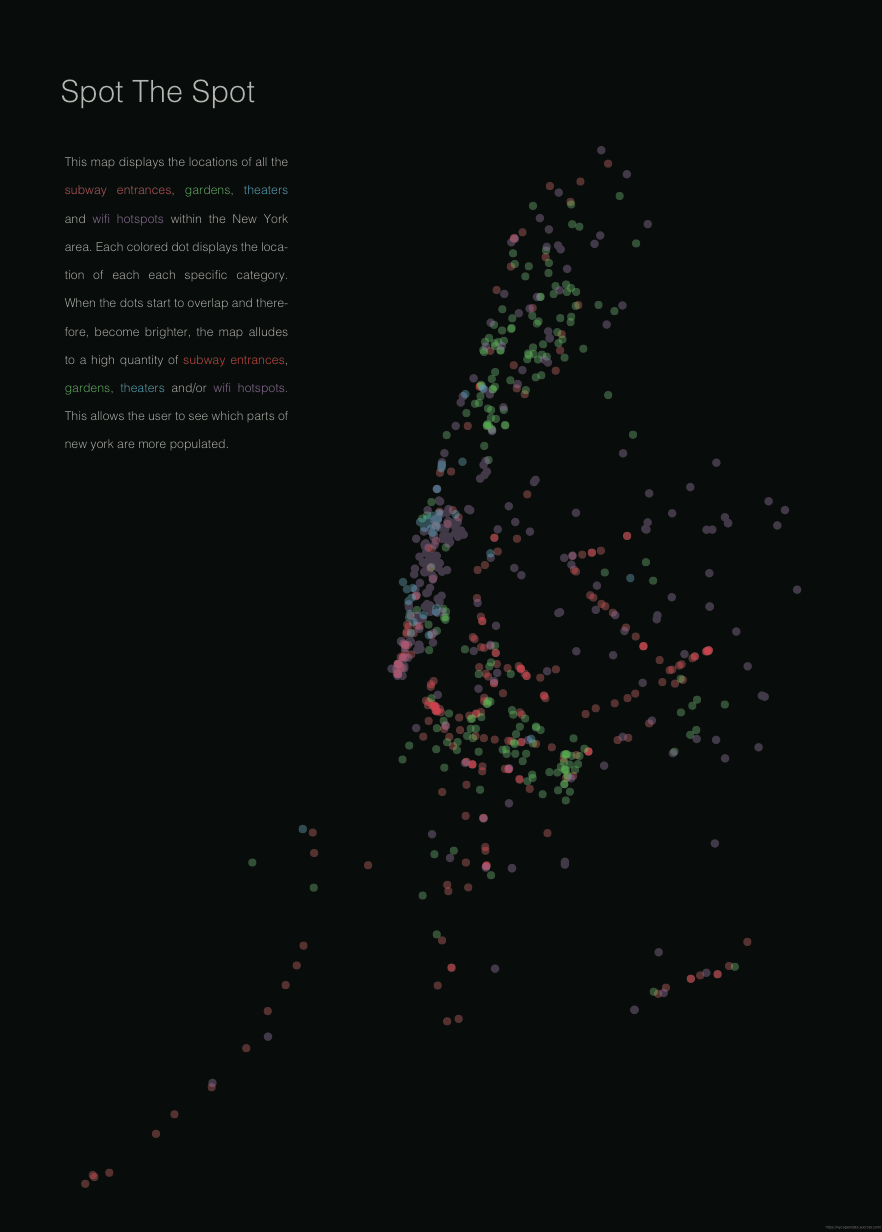
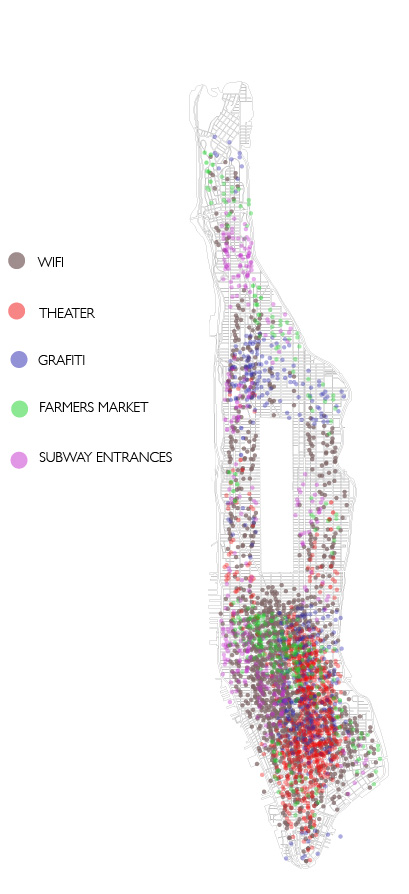
Spot the spot is an information graph that illustrates the location of subway entrances, gardens, theaters, and wifi hotspots within the New York area. Each location has a different color dot in order to locate each location separately. When there are a lot of the same or different subject in the same location, the satiation of the dot becomes higher, making it appear brighter on the graph.

The goal of this graph is to view New York from the different locations. When there is a congestion of dots, or places, it alludes to more urban areas. When there is less dots in the same location it can be understood that that area is more rural.

Information:

All the information for this graph is found on https://nycopendata.socrata.com.

Process:

This poster is constructed by downloading CSV files into processing, coding the information, and then designing the graph in illustrator.

IMG_4578 IMG_4581IMG_4587 IMG_4597IMG_4580 IMG_4595

Little Big Data – Spot the Spot

This map displays the locations of all the subway entrances, gardens, theaters and wifi hotspots within the New York area. Each colored dot displays the location of each each specific category. When the dots start to overlap and therefore, become brighter, the map alludes to a high quantity of subway entrances, gardens, theaters and/or wifi hotspots. This allows the user to see which parts of new york are more populated.


PDF: map3


JPG: Screen Shot 2014-10-27 at 8.21.16 PM


Code:

import processing.pdf.*;
void setup (){
size (800, 800);
noLoop();
}
float highestValue = -123.118095;
//float lastHighestLong = 0;
int size = 5;
int op = 50;

//////////////////////////////////////////////////draw/////////

void draw () {

beginRecord(PDF, “output3.pdf”);

//////////////////////////////////////////////////////////////subway////

Table subwaycsv = loadTable ( “subway2.csv”, “header”);
String latLong;
int count = 0;
for (TableRow row : subwaycsv.rows() ){
count++;
latLong = row.getString(“hello”);
String[] latList = split(latLong, ” “);
// float latitude = float(latList[0]);
String latitudeString = latList[0].substring( 0, latList[0].length()-1 );
float latitude = float(latitudeString);
// println(latitude);
float longitude = float(latList[1]);

if(latitude>highestValue && latitude<0){
highestValue = latitude;
println(highestValue);
}

// println(“lat: ” + latitude + ” long: ” + longitude);
// if(latitude > -73.910196 && latitude < -74.014959 && longitude > 40.703436 && longitude < 40.877644){
float xPos = map(latitude, -74.5, -73.5, 0, 800);
float yPos = map(longitude, 41, 40.5, 0, 800);
// println(count + ” lat: ” + latitude + ” long: ” + longitude);

fill(255, 0, 0, op);
noStroke();
ellipse(xPos, yPos, size, size);
// }else{
// println(count + ” nope.”);
// }

// println(xPos);

}
///////////////////////////////////////////////////// GARDENS///////////
Table gardenscsv = loadTable ( “gardens1.csv”, “header”);
String latLong1;
int count1 = 0;
for (TableRow row : gardenscsv.rows() ){
count++;
latLong1 = row.getString(“hello”);
String[] latList1 = split(latLong1, ” “);
// float latitude = float(latList[0]);
String latitudeString1 = latList1[0].substring( 0, latList1[0].length()-1 );
float latitude1 = float(latitudeString1);
// println(latitude);
float longitude1 = float(latList1[1]);

if(latitude1>highestValue && latitude1<0){
highestValue = latitude1;
println(highestValue);
}

// println(“lat: ” + latitude + ” long: ” + longitude);
// if(latitude > -73.910196 && latitude < -74.014959 && longitude > 40.703436 && longitude < 40.877644){
float xPos = map(latitude1, -74.5, -73.5, 0, 800);
float yPos = map(longitude1, 41, 40.5, 0, 800);
// println(count + ” lat: ” + latitude + ” long: ” + longitude);

fill(5, 250, 15, op);
noStroke();
ellipse(xPos, yPos, size, size);
// }else{
// println(count + ” nope.”);
// }

// println(xPos);

}
/////////////////////////////////////////////////////////WIFI///////////
Table wificsv = loadTable ( “wifi1.csv”, “header”);
String latLong2;
int count2 = 0;
for (TableRow row : wificsv.rows() ){
count++;
latLong2 = row.getString(“hello”);
String[] latList2 = split(latLong2, ” “);
// float latitude = float(latList[0]);
String latitudeString2 = latList2[0].substring( 0, latList2[0].length()-1 );
float latitude2 = float(latitudeString2);
// println(latitude);
float longitude2 = float(latList2[1]);

if(latitude2>highestValue && latitude2<0){
highestValue = latitude2;
println(highestValue);
}

// println(“lat: ” + latitude + ” long: ” + longitude);
// if(latitude > -73.910196 && latitude < -74.014959 && longitude > 40.703436 && longitude < 40.877644){
float xPos = map(latitude2, -74.5, -73.5, 0, 800);
float yPos = map(longitude2, 41, 40.5, 0, 800);
// println(count + ” lat: ” + latitude + ” long: ” + longitude);

fill(208, 5, 252, op);
noStroke();
ellipse(xPos, yPos, size, size);
// }else{
// println(count + ” nope.”);
// }

// println(xPos);

}

/////////////////////////////////////////////////////////////THEATERS////////

Table theaterscsv = loadTable ( “theaters1.csv”, “header”);
String latLong3;
int count3 = 0;
for (TableRow row : theaterscsv.rows() ){
count++;
latLong3 = row.getString(“hello”);
String[] latList3 = split(latLong3, ” “);
// float latitude = float(latList[0]);
String latitudeString3 = latList3[0].substring( 0, latList3[0].length()-1 );
float latitude3 = float(latitudeString3);
// println(latitude);
float longitude3 = float(latList3[1]);

if(latitude3>highestValue && latitude3<0){
highestValue = latitude3;
println(highestValue);
}

// println(“lat: ” + latitude + ” long: ” + longitude);
// if(latitude > -73.910196 && latitude < -74.014959 && longitude > 40.703436 && longitude < 40.877644){
float xPos = map(latitude3, -74.5, -73.5, 0, 800);
float yPos = map(longitude3, 41, 40.5, 0, 800);
// println(count + ” lat: ” + latitude + ” long: ” + longitude);

fill(249, 250, 5, op);
noStroke();
ellipse(xPos, yPos, size, size);
// }else{
// println(count + ” nope.”);
// }

// println(xPos);

//println(“Finished”);
//exit();

}

endRecord();

}

Little Big Data Comp

SUBJECT:

My poster will be mapping different locations within New York City. For example, one of my categories is called “Subway Entrances”, which means I will be mapping all of the subway entrances within Manhattan. I will be placing the location of each subway entrance by displaying a small dot with a specific color, indicating the exact location of the subway entrance.  My data visualization will illustrate a clear congestion of dots within certain areas of manhattan. This will suggest that a lot of people are usually around that specific area, while the areas that have less dots will led one to think that there must not be as many people in that specific area.

DATA: 

I started to accumulate my data from data.gov, which lead me to New York City Open Data. After looking through a lot of different information, I thought it would be fascinating to indicate where certain things are located in Manhattan. With that said, I downloaded CSVs from their website that located unique things.

The data I have is different locations of:

– Wifi

-Subway Entrances

-Graffiti

-Movie Theaters

-Farmer Markets

TOOLS AND APPROACH:

In order to understand the best way of visualizing this information, I will create a plot graph on New York City. I will create small dots that are different colors to display the different categories and locations. Some of the dots will be very close together and possibly overlap.This will indicate that a specific area is busy and congested, while an area that has less dots or only a specific color of dot will be viewed as less commercial and more residential or just simply less congested.

DESIGN:

trial.psd

Makeover Assignment

Here are a few problems with the infograph that I found:

1) It can be initially hard to understand what the graph is discussing.

2) One cannot read it if one is color blind.

3) The circles are not in the same order, and therefore become complicated to understand what the true information is speaking about.

4) When listing the amount of money each disease has raised, it looks like the circles represents the collective amount that all of the organizations raised for that specific disease. When in reality the graph is showing how much that specific organization has raised alone.


Original Infograph: http://andrewgelman.com/wp-content/uploads/2014/08/hyU8ohq.jpg


Makeover: Infograph_Fix

Research Assignment

Data Visualization Aggregator

http://vw.indiana.edu/07netsci/entries/submissions/fullsize/18Colizza.tif?FILE=vcolizza/90828WgNShG

This is an information graph displaying how the SARS epidemic has traveled around the world through air transportation. This map illustrates the pathways of the epidemic and a 1-4 week time frame of countries that were more effected from SARS.

A visualization 

http://ftw.usatoday.com/2014/06/world-cup-games-twitter

This is a visualization of the amount of tweets that were posted during the 2014 World Cup Games. The visualization shows the currents and flows of the amount of fans cheering and posting tweets about their teams and how the location of the tweets and the amount of tweets posted fluctuated through out the game.

Artist/Designer 

http://this-is-maral.com

Maral Pourkazmei is a designer who believes that design has the potential to make the invisible visible.

Visualization Tool 

http://www.fastcodesign.com/3029239/infographic-of-the-day/30-simple-tools-for-data-visualization

This lists 30 tools for simple data visualizations.

Data Collection Tool

Data Collection Tools

These are a few data collection tools that help one understand how to collect the data that they need.

Discussion Forum 

http://visualized.com

On this website  one may find videos, artist and designs discussing and displaying data, design and visualization. Additionally, Visualized has conferences around the world discussing these topics.

Criticism

http://thumbsupviz.com

This website has a blog of criticisms regarding peoples work. Once someone posts their art other artist and designers can evaluate their work and critique it.

Data Source 

Home

Pew Research is a site that carries numerous amount of different type of information for the public.

Data Ethics

http://www.forbes.com/sites/oreillymedia/2014/03/28/whats-up-with-big-data-ethics/

The Forbes article writes about Big Data ethics and how to preserve ones identity and privacy.

A Book 

Visualizing Data: Exploring and Explaining With The Processing Environment

This book speaks of 7 stages of visualizing data, understanding of the methods behind visualization, helpful coding tips and so on.

This is a book review that I found helpful when learning about this book: http://www.ariadne.ac.uk/issue56/cliff-rvw