All posts by Sunghoon Kim

Up-To-Date Data Visualization – Planetify

Planetify website

Intro Pageplanetify 1

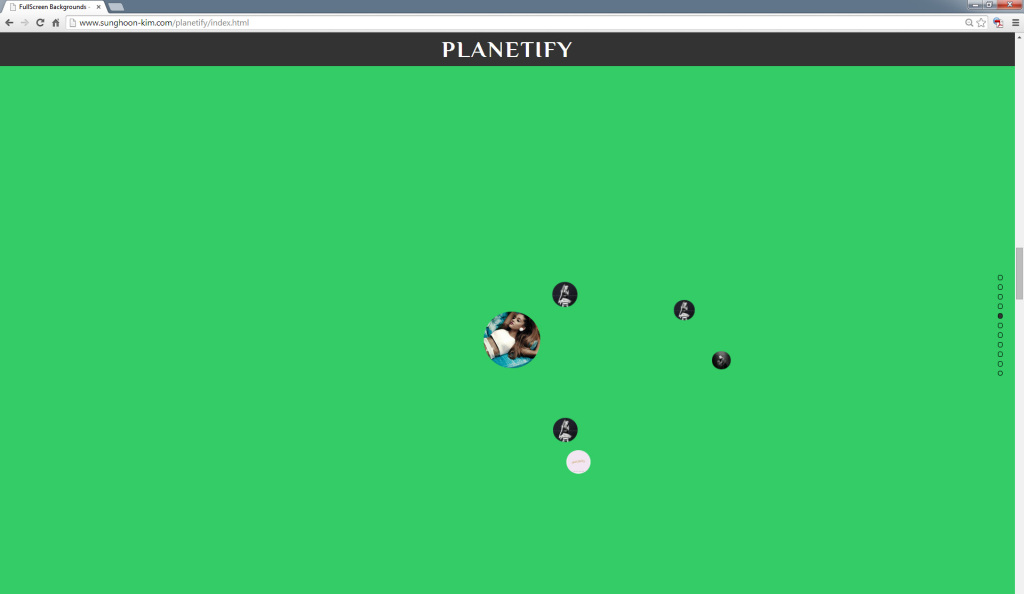
7th Star Page: Ariana Grandeplanetify2

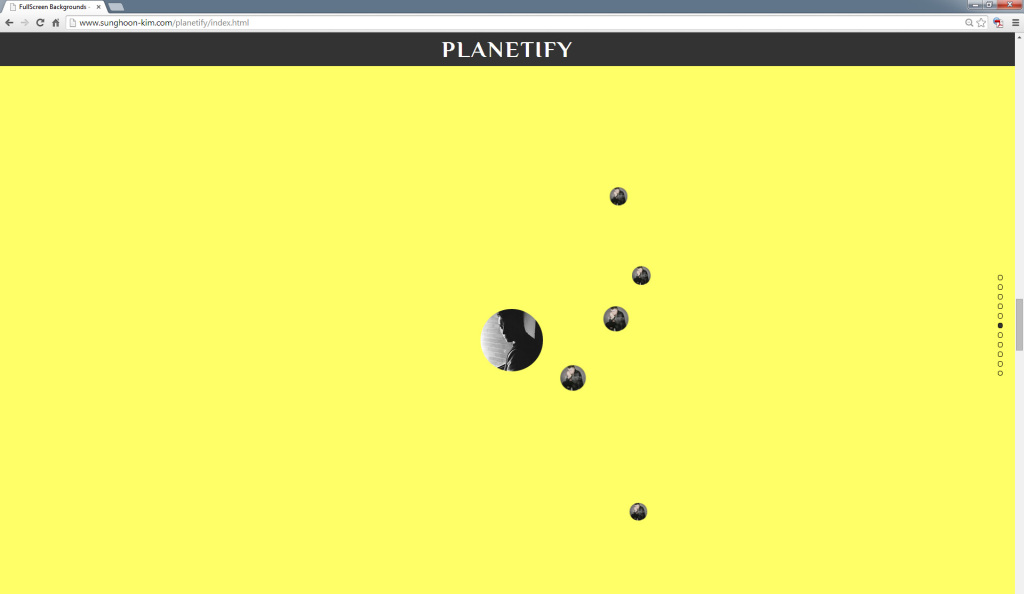
6th Star Page: Sam Smithplanetify3

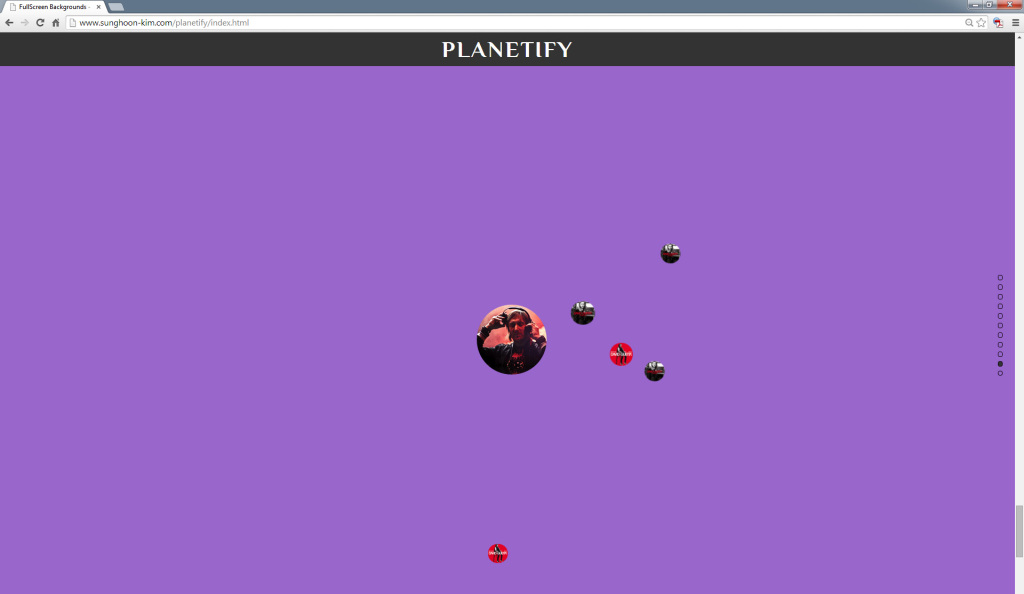
2nd Star Page: David Guettaplanetify4

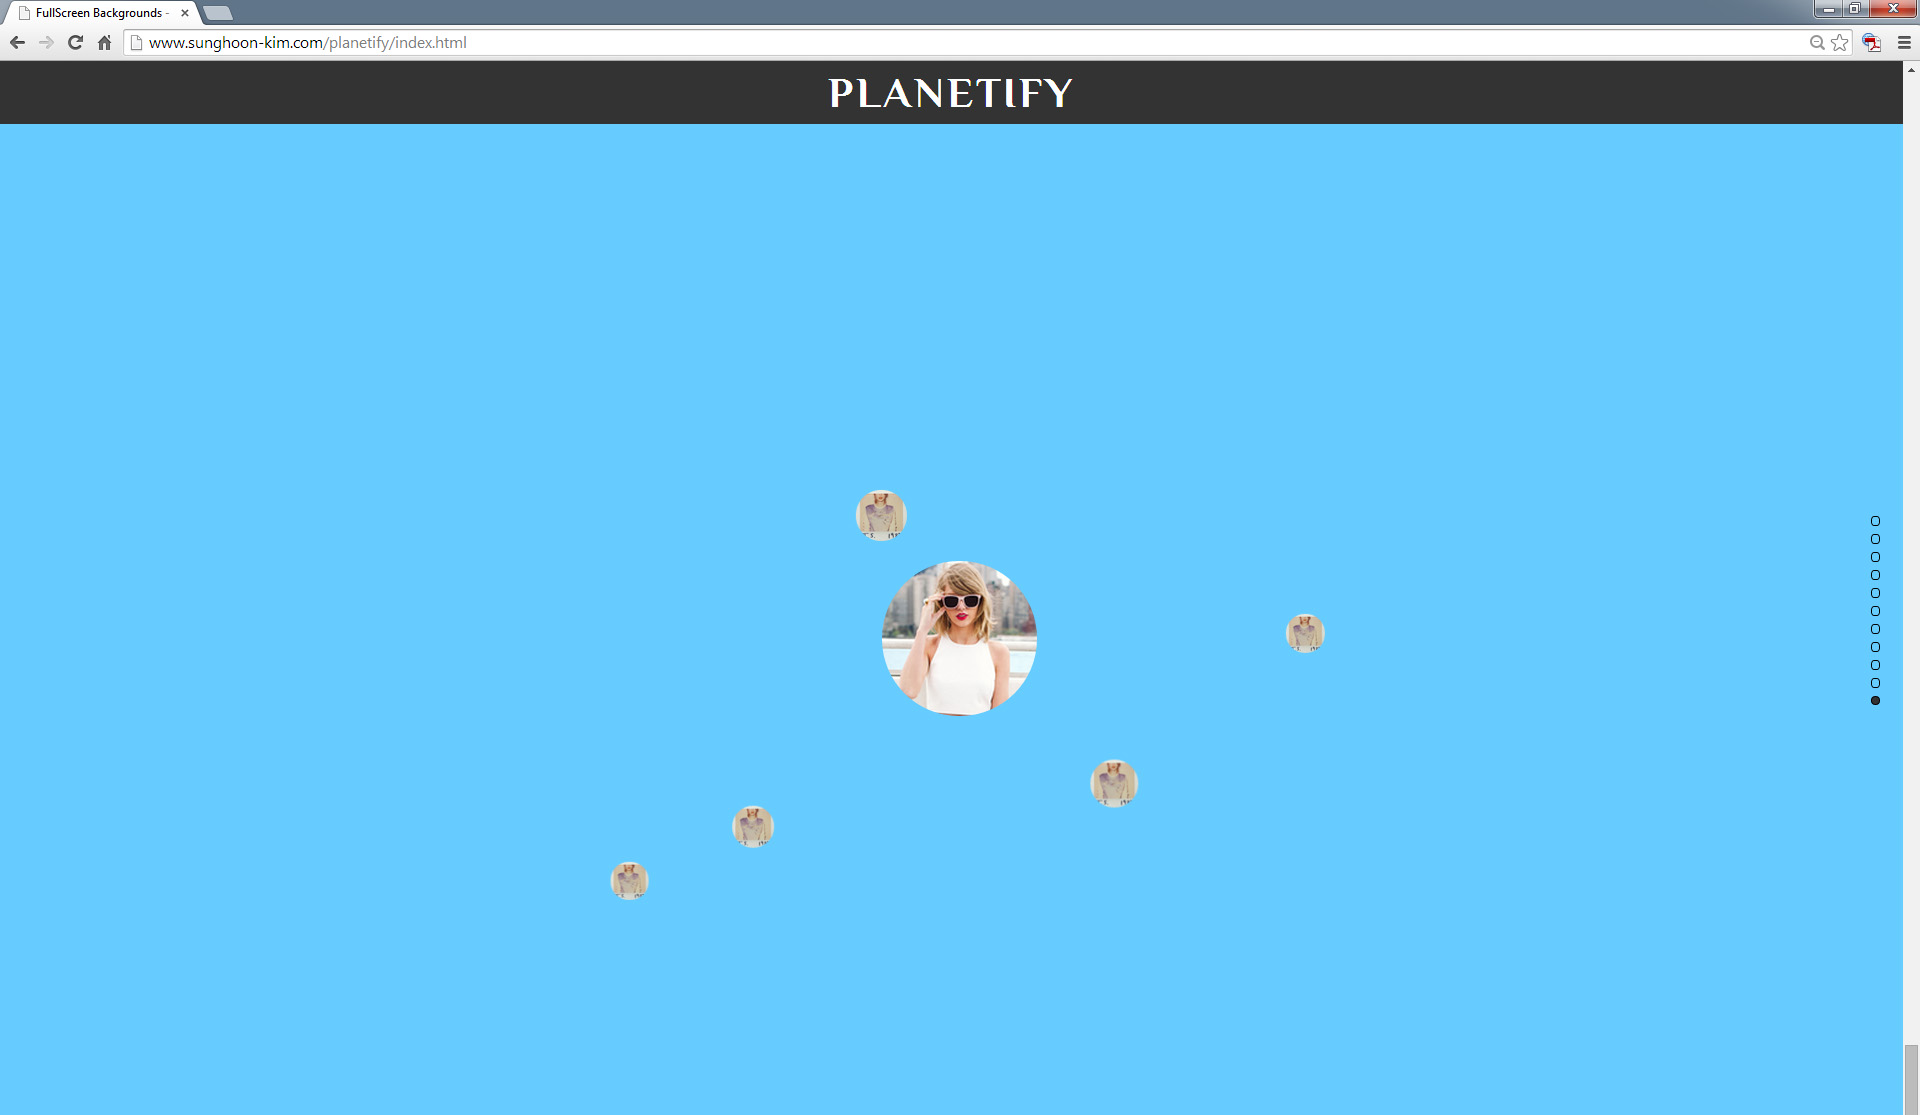
1st Star Page: Taylor Swiftplanetify5

(Retrieved and captured on December 12 2014 at 8:30 p.m.)

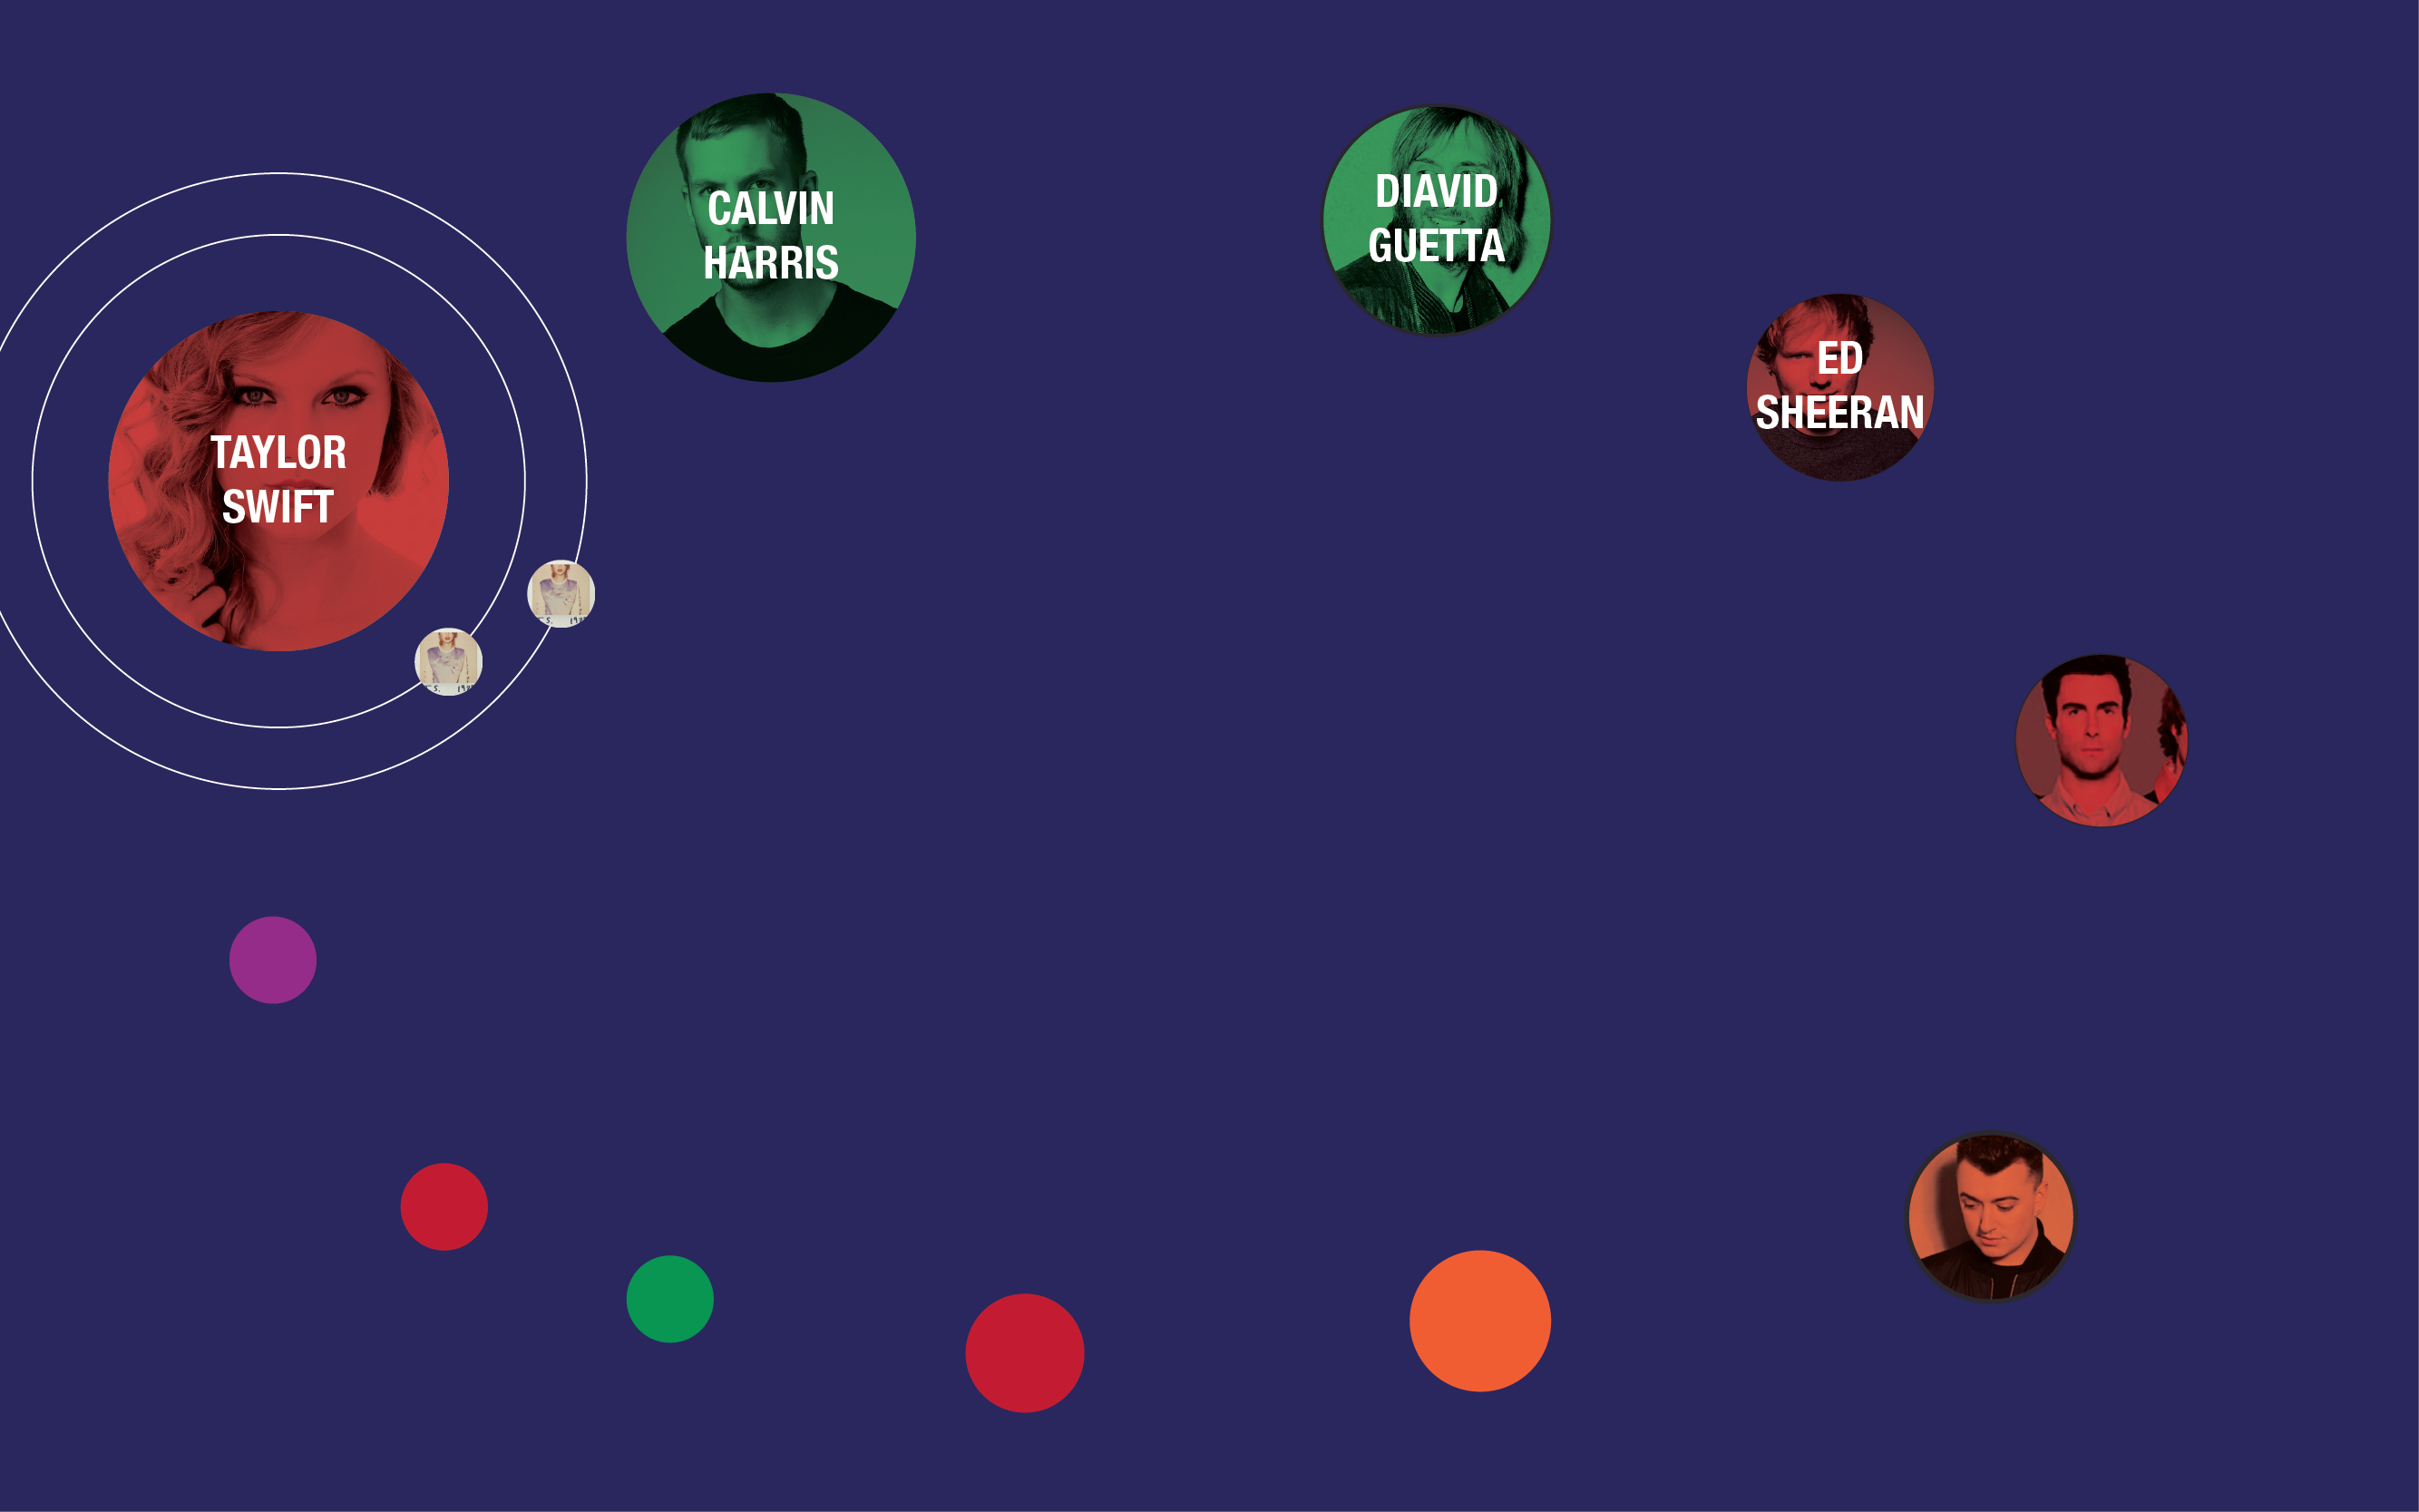
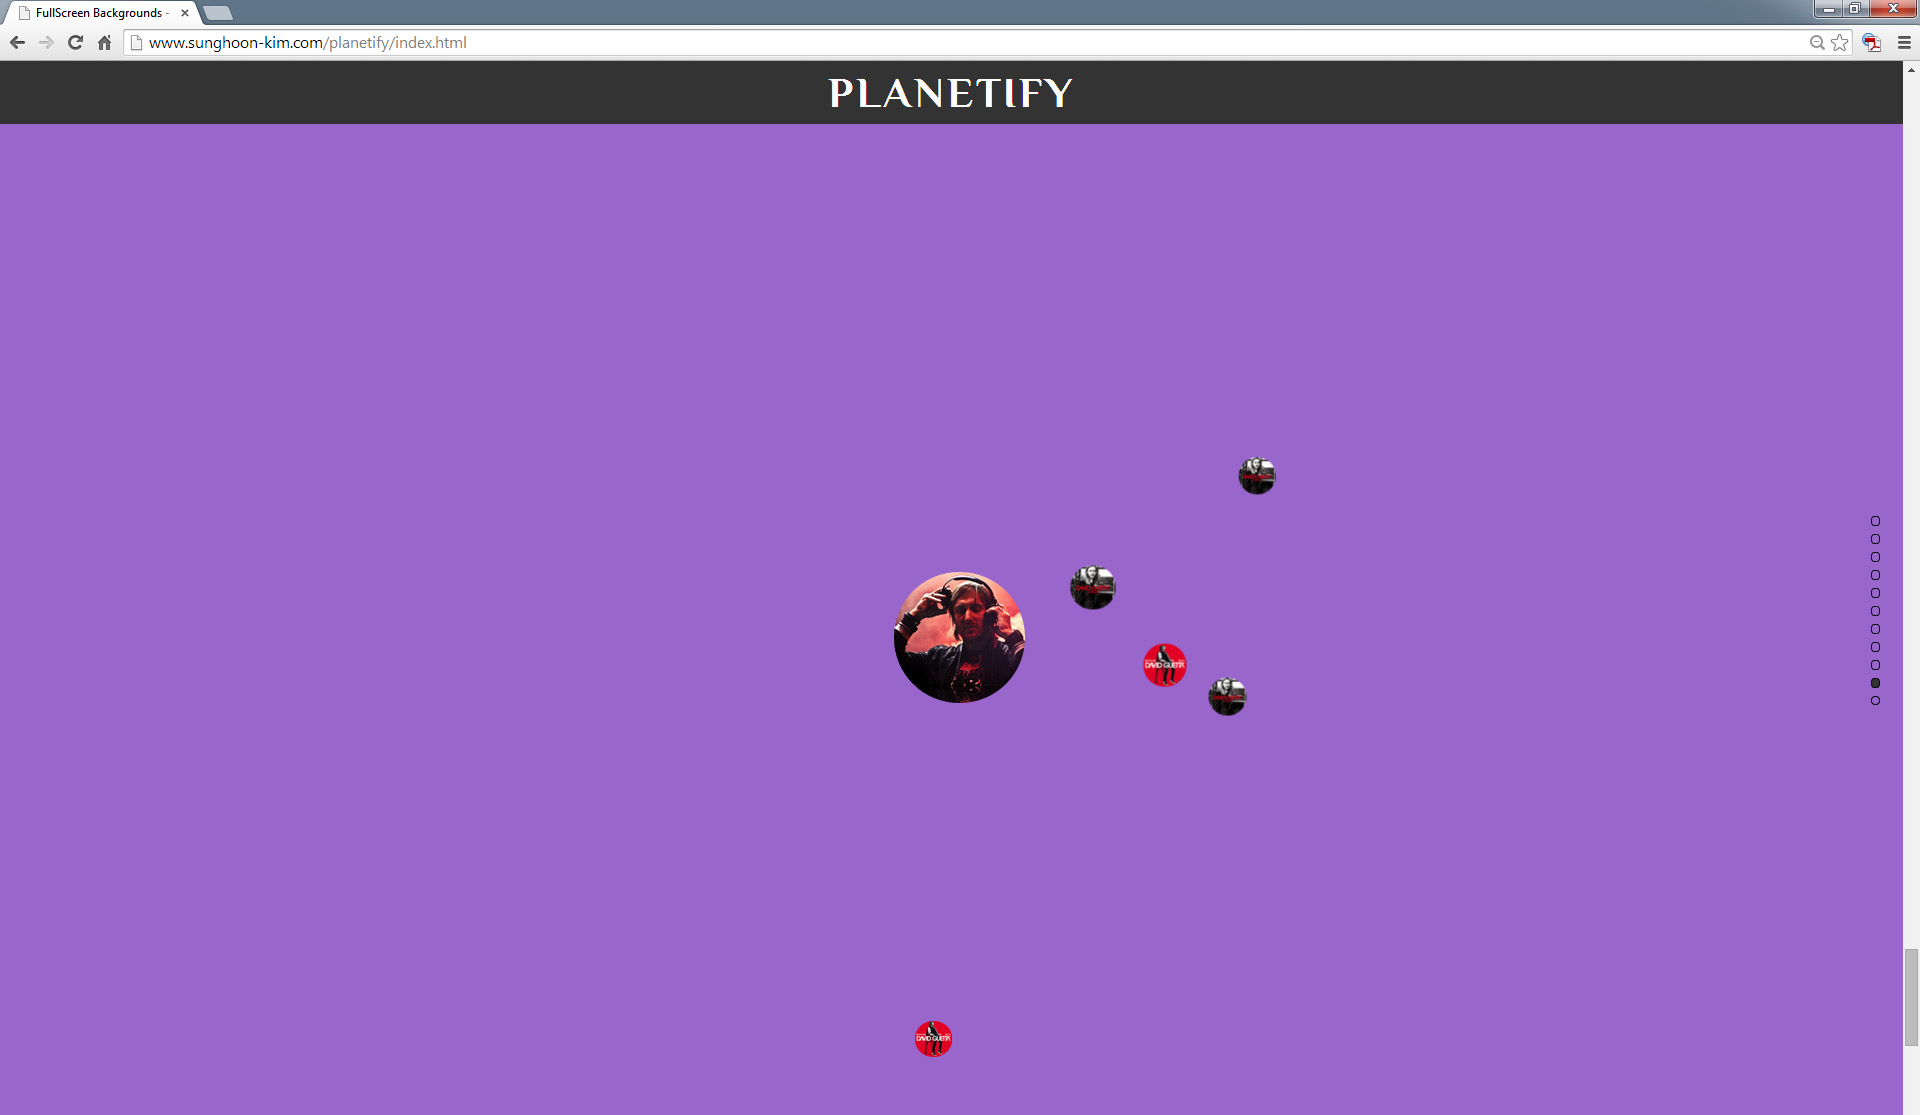
Planetify is an interactive website that displays the brightest “stars” at this moment. Up-to-date data the website uses comes from three different sources: EchoNest, LastFM, and iTunes. Each source provides with information regarding artists and their popularity(EchoNest), images of artists and albums(LastFM), and previews of each song(iTunes) respectively.  Each star and its planets are generated once the data is retrieved, and every system has a rule to follow when they are visualized. The popularity of stars determines the size of the star, and the bigger and inner the planet is, the bigger popularity it indicates separately. Also, the background will be color-coded based on the genre of each artist. While you are scrolling down in order to explore “stars,” you  can see which stars are popular now, how popular they are, and which songs each star has are popular. If I work on more later, I would like to add one page in which you can see more collective information of ten popular stars in order to see all the artists synthetically at once, and compare the popularity of stars.
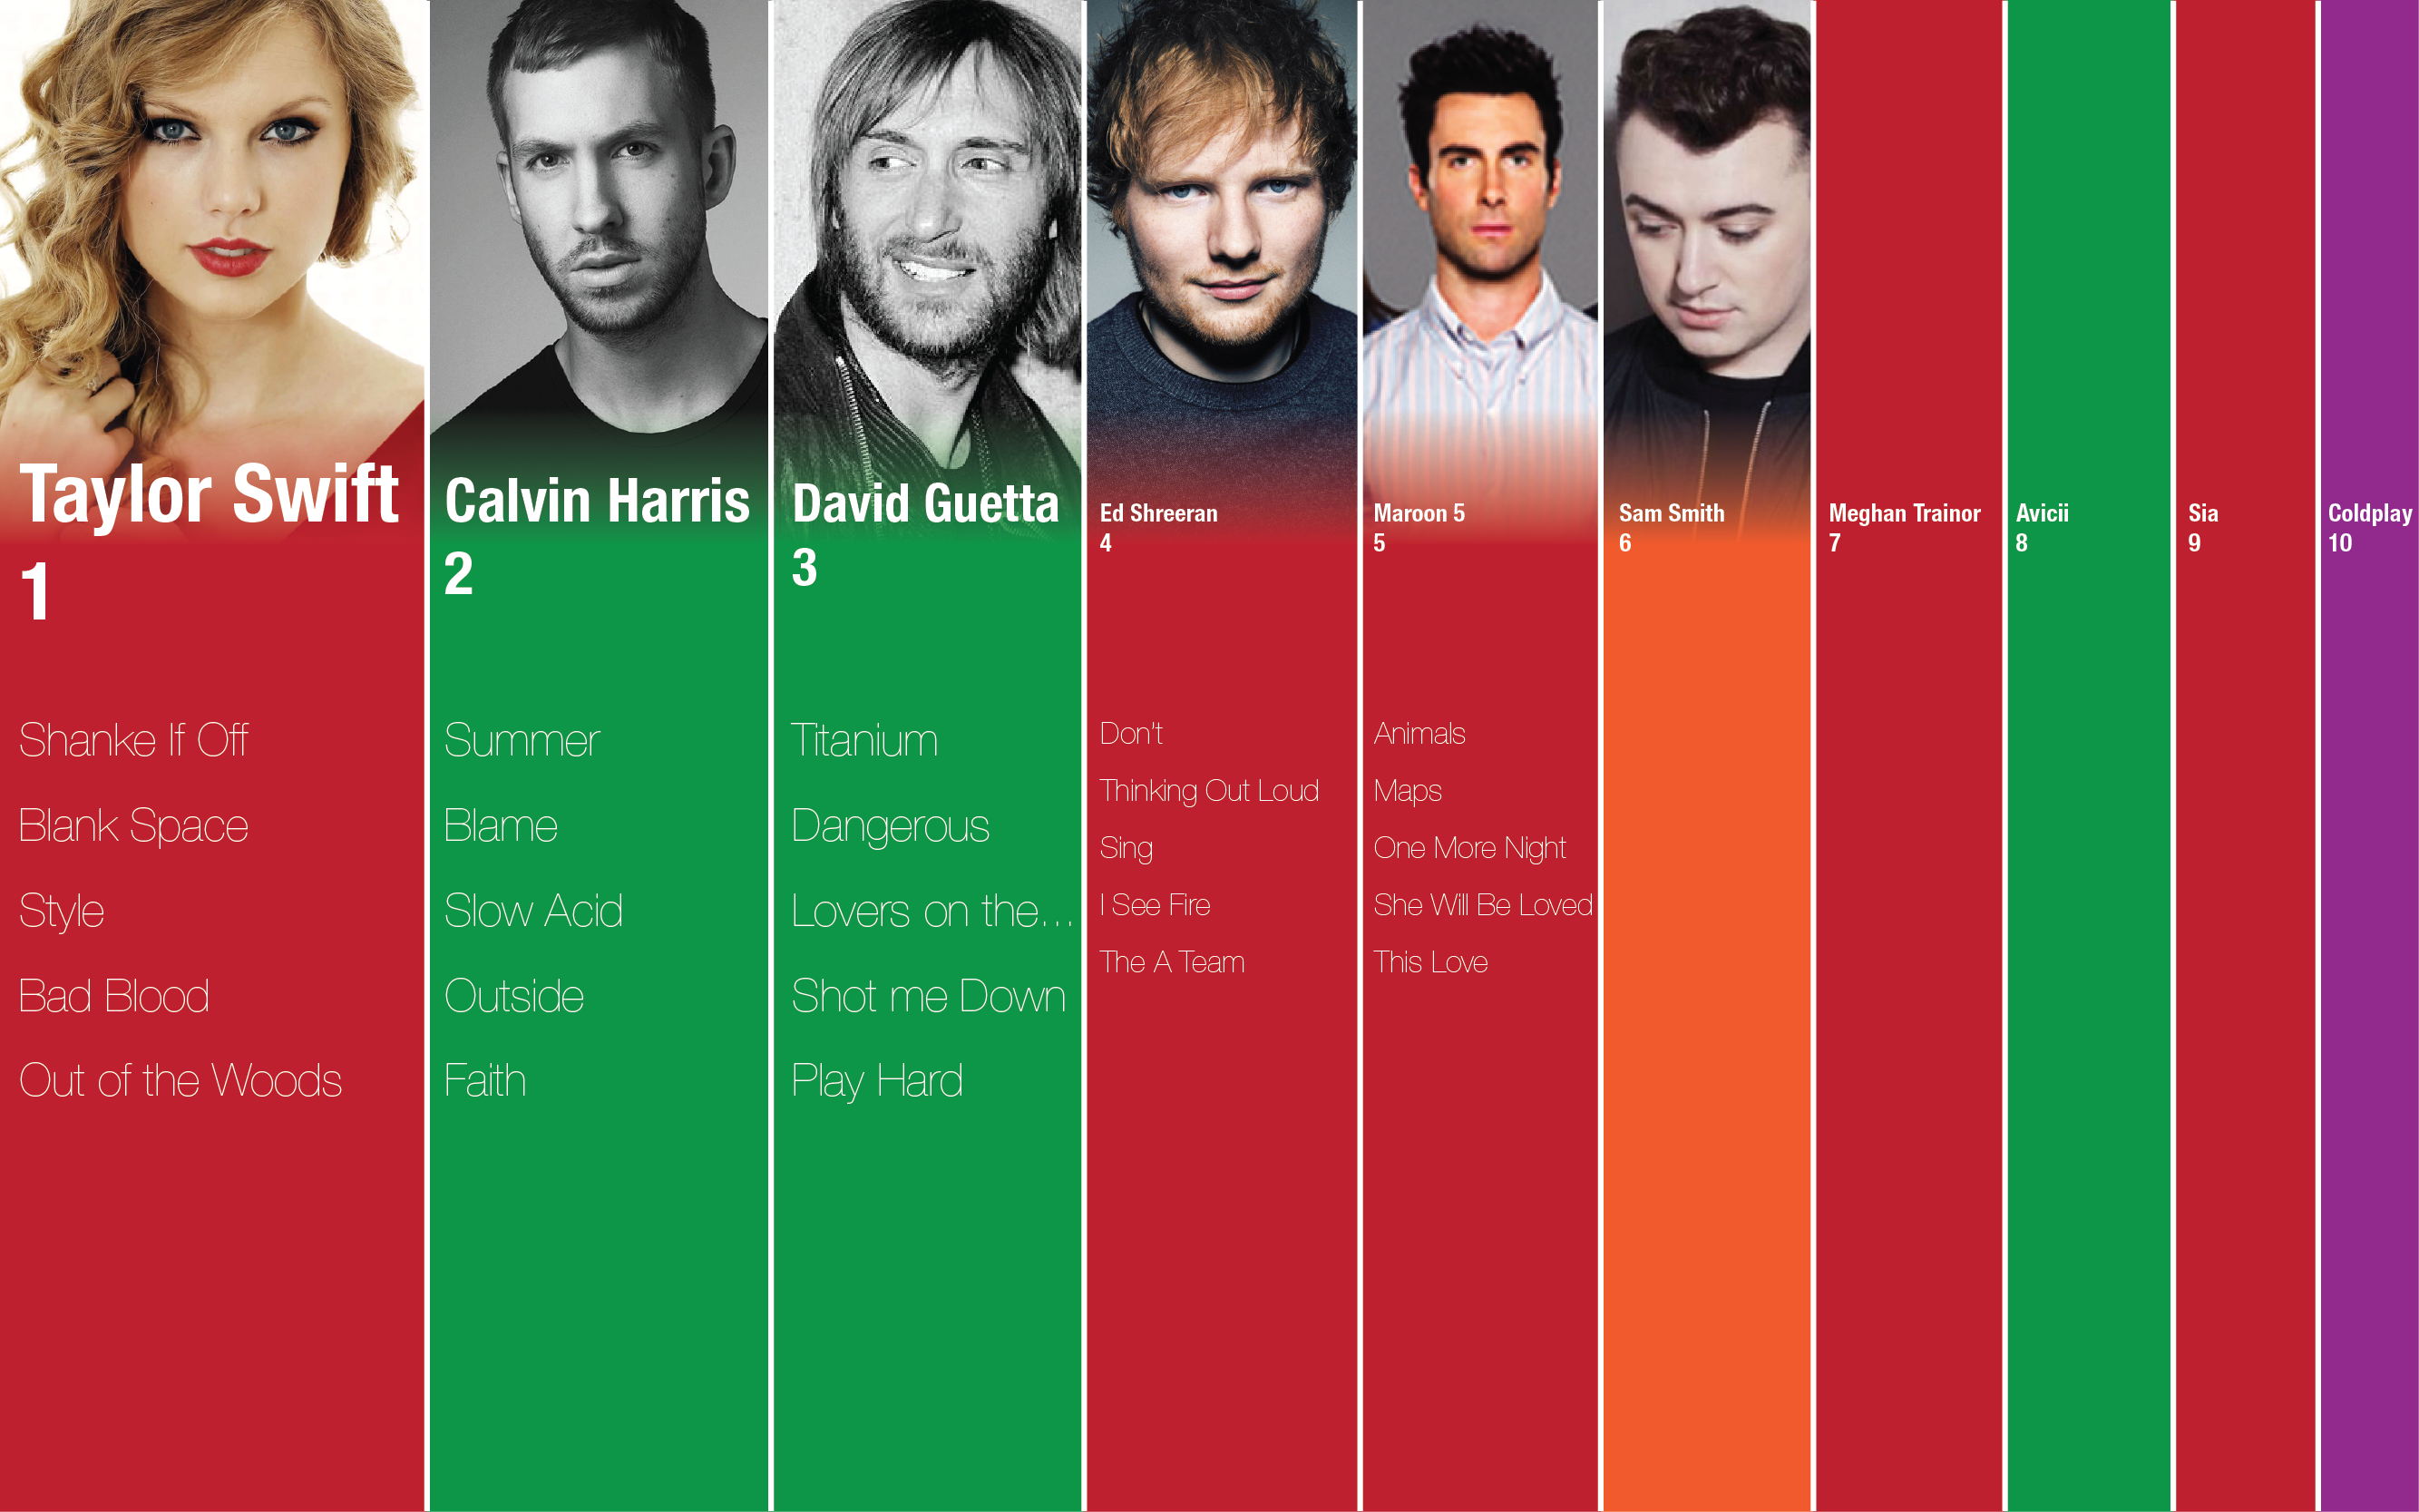
Up-to-date Data Visualization POC

POC

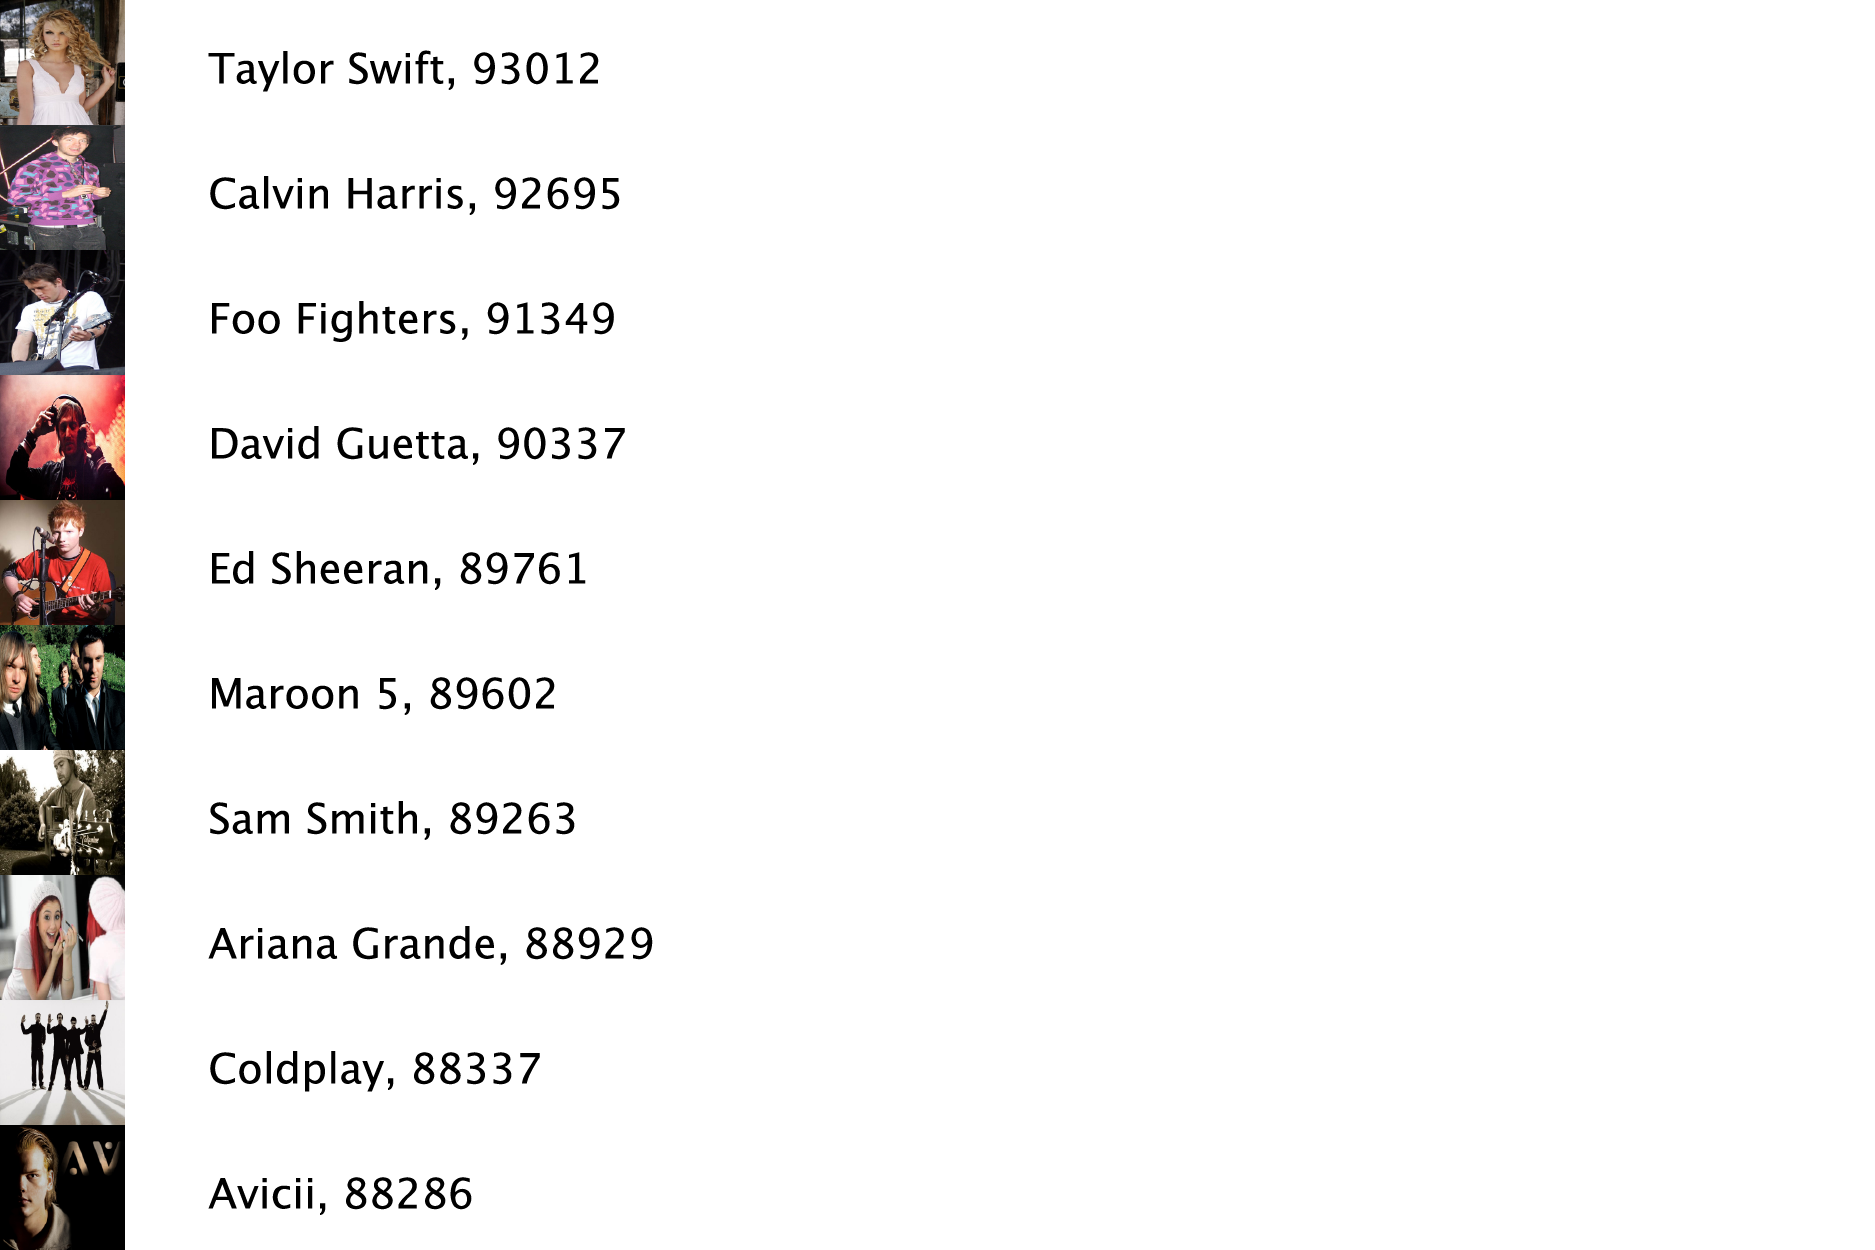
From Echonest, I was able to get data about the top 10 most popular artists at this moment as well as images of these artists. Also, I could get the popularity that indicates how popular the artists are. I can visualize the data to show how dominant they are within the rank. The next task I’m going to do will be retrieving a set of tweets about the 10 artists from twitter.

music_rank_1 (code)

POC.pdf

Final Assignment (Up-to-date Data Visualization) Proposal

Subject

For the final assignment, I will make a visulization that reflects up-to-date data regarding popularities of musical artists in order to show which musicians are the most popular at the moment. I like listening to music and am interested in pop culture. Even though this does not mean that I like all the musicians, it is always interesting to see not only other people’s opinions on popular musicians who I don’t like that much, but also “stars” themselves brighting the most now. Competition between musicians is very intense, but I can rarely feel it because of a different notion between being popular among the public and the popularity you can actually sense. This visualization will display both the rank of musicians according to their popularities, and their corresponding reactions online, which can be flowing out endlessly on Twitter, Instagram, and Tumblr; after all, it eventually lets you know which “star” shines the brightest.

Data

The main data that I will source is Echonest, which provides various and in-depth information related to music. What they provide is a lot of methods that return data ranging from artists and songs to their profiles, popularities and reviews. The most important part that I’m going to use specifically is the rank of “hotttnesss,” which indicates how popular one particular artist or song is at this moment. Besides Echonest, I will use Twitter API library on Temboo (as well as Instagram API, probably though) to retrieve some twits that contain hashtags related to certain musicians so that you can see people’s thoughts about the popularity. Both Echonest and Twitter API are hard to manage because of their massive volume and the fact that the way to get the data is pretty tricky, but once I am able to get the data, it will definitely allow me to make an interesting visualization.

Tool

Tool that I’m going to use is Processing just because it is the most comfortable tool to me so far, still difficult though. However, if the data becomes manageable, because the data I’ll use is Jquery, I’m thinking of change the code to Javascript so that I can make it accessible to anyone online through my website.

Comp

I have two different versions I’m thinking of for the final visualization. The first version emphasizes how much each artist dominates in the rank, and the second version focuses on the similar hierarchy between the solar system, and “star” and songs.

comp ver1ver.1

comp ver2ver.2


Little Big Data – Cities We Live In

Cities We Live In (pdf)

urbanization data visualization


Overview

overview


Detailed View

detailed view 1

detailed view 2

detailed view 3

detailed view 4

detailed view 5


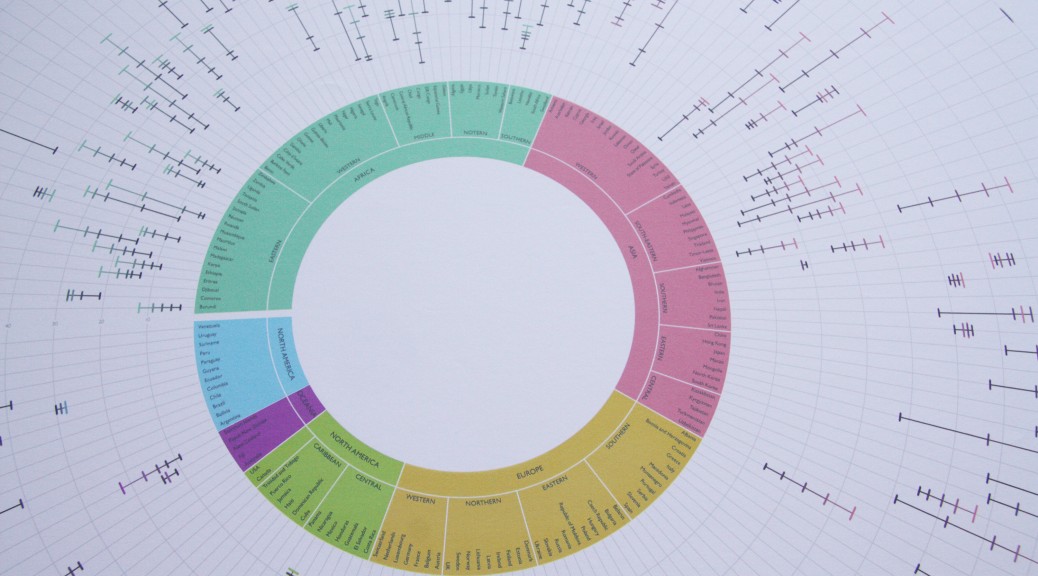
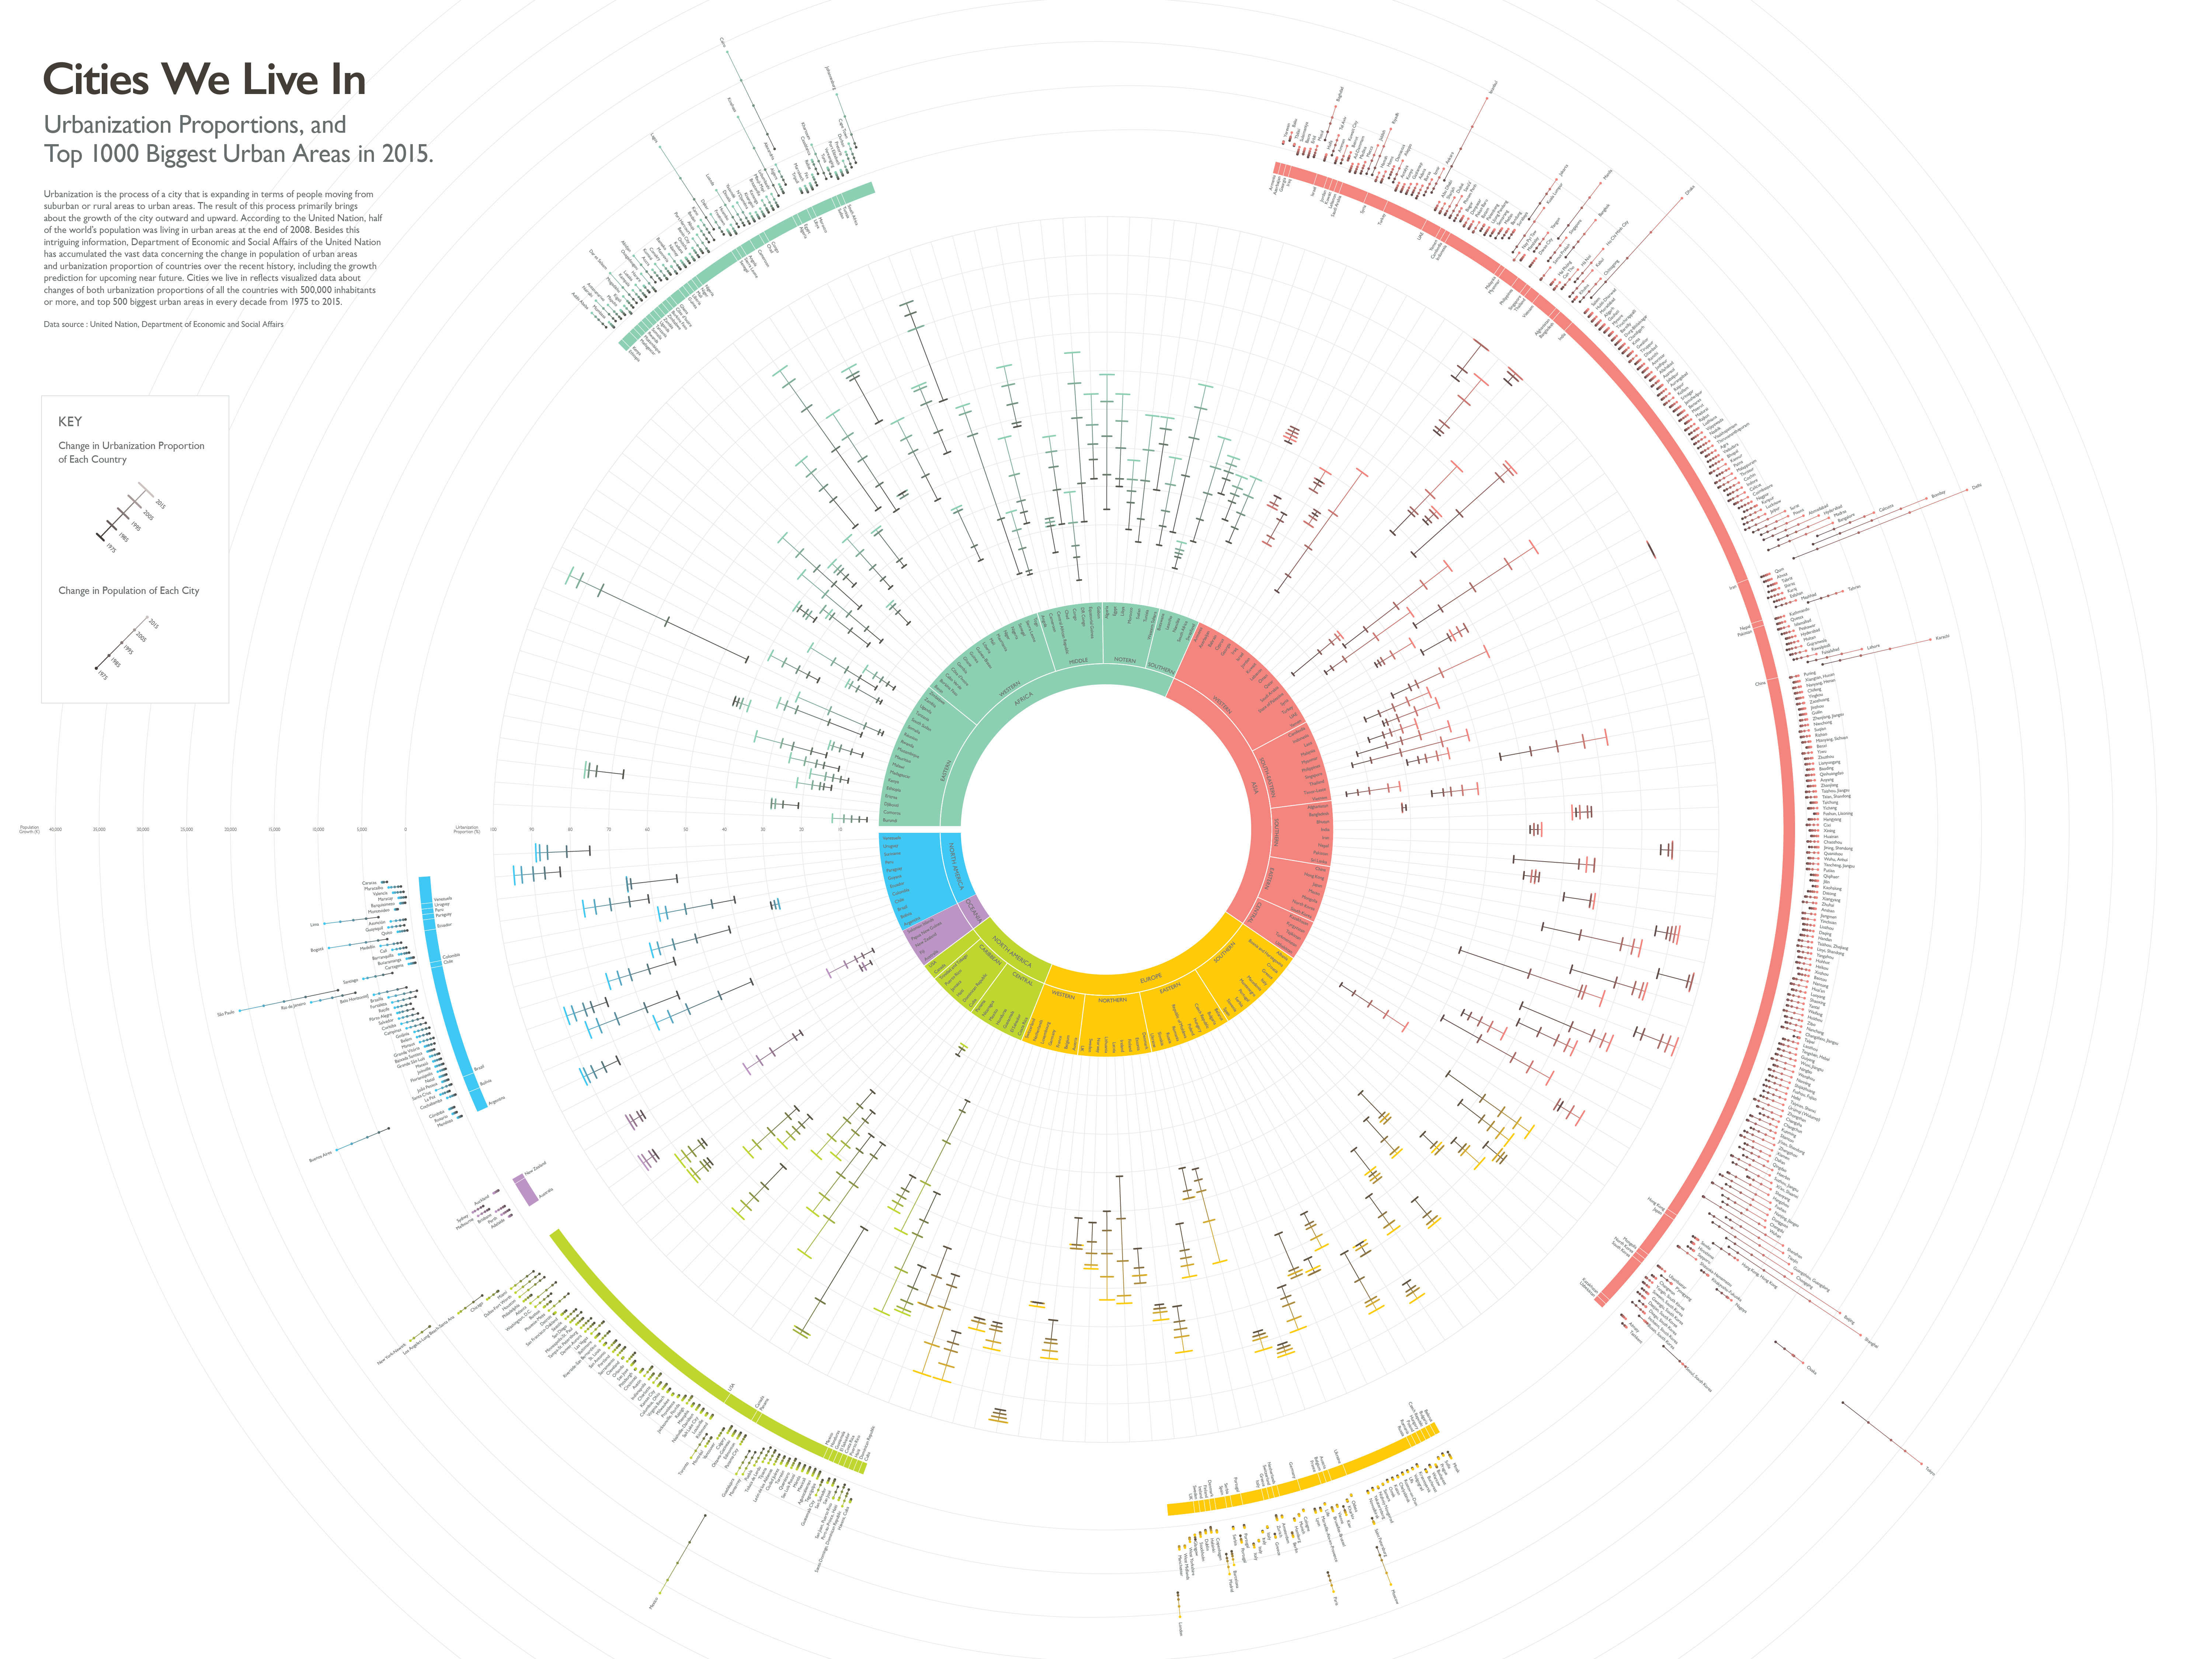
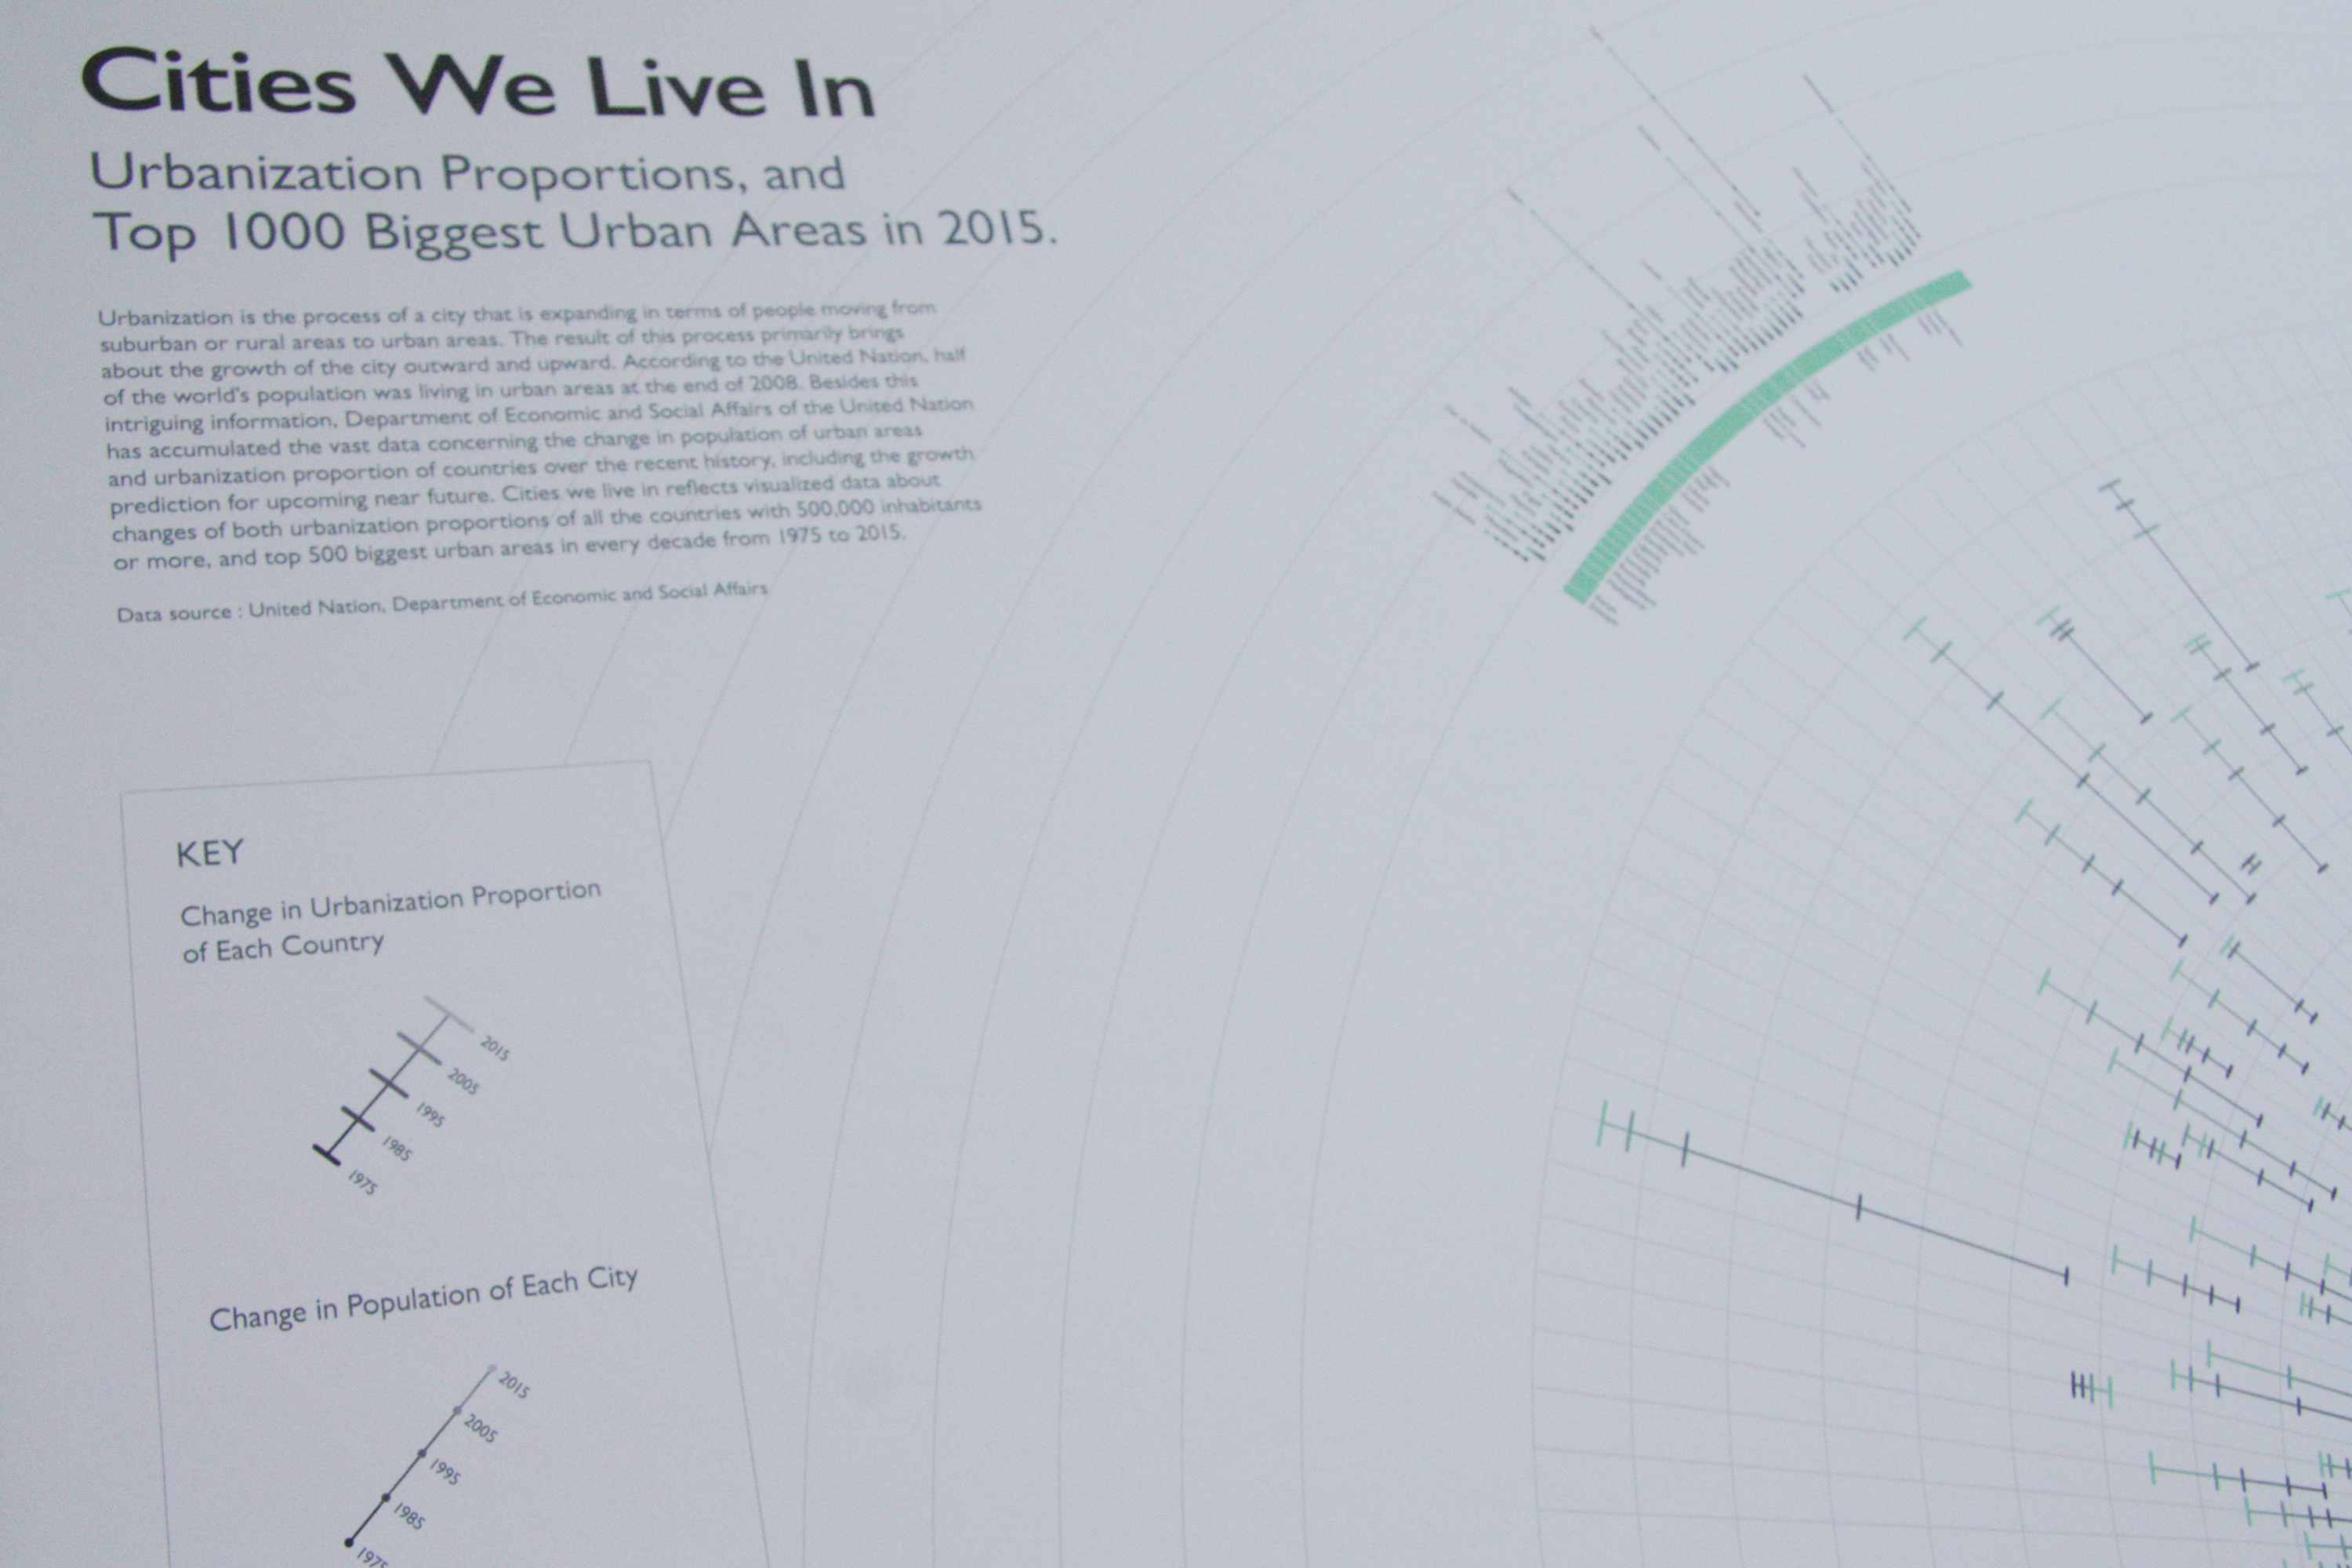
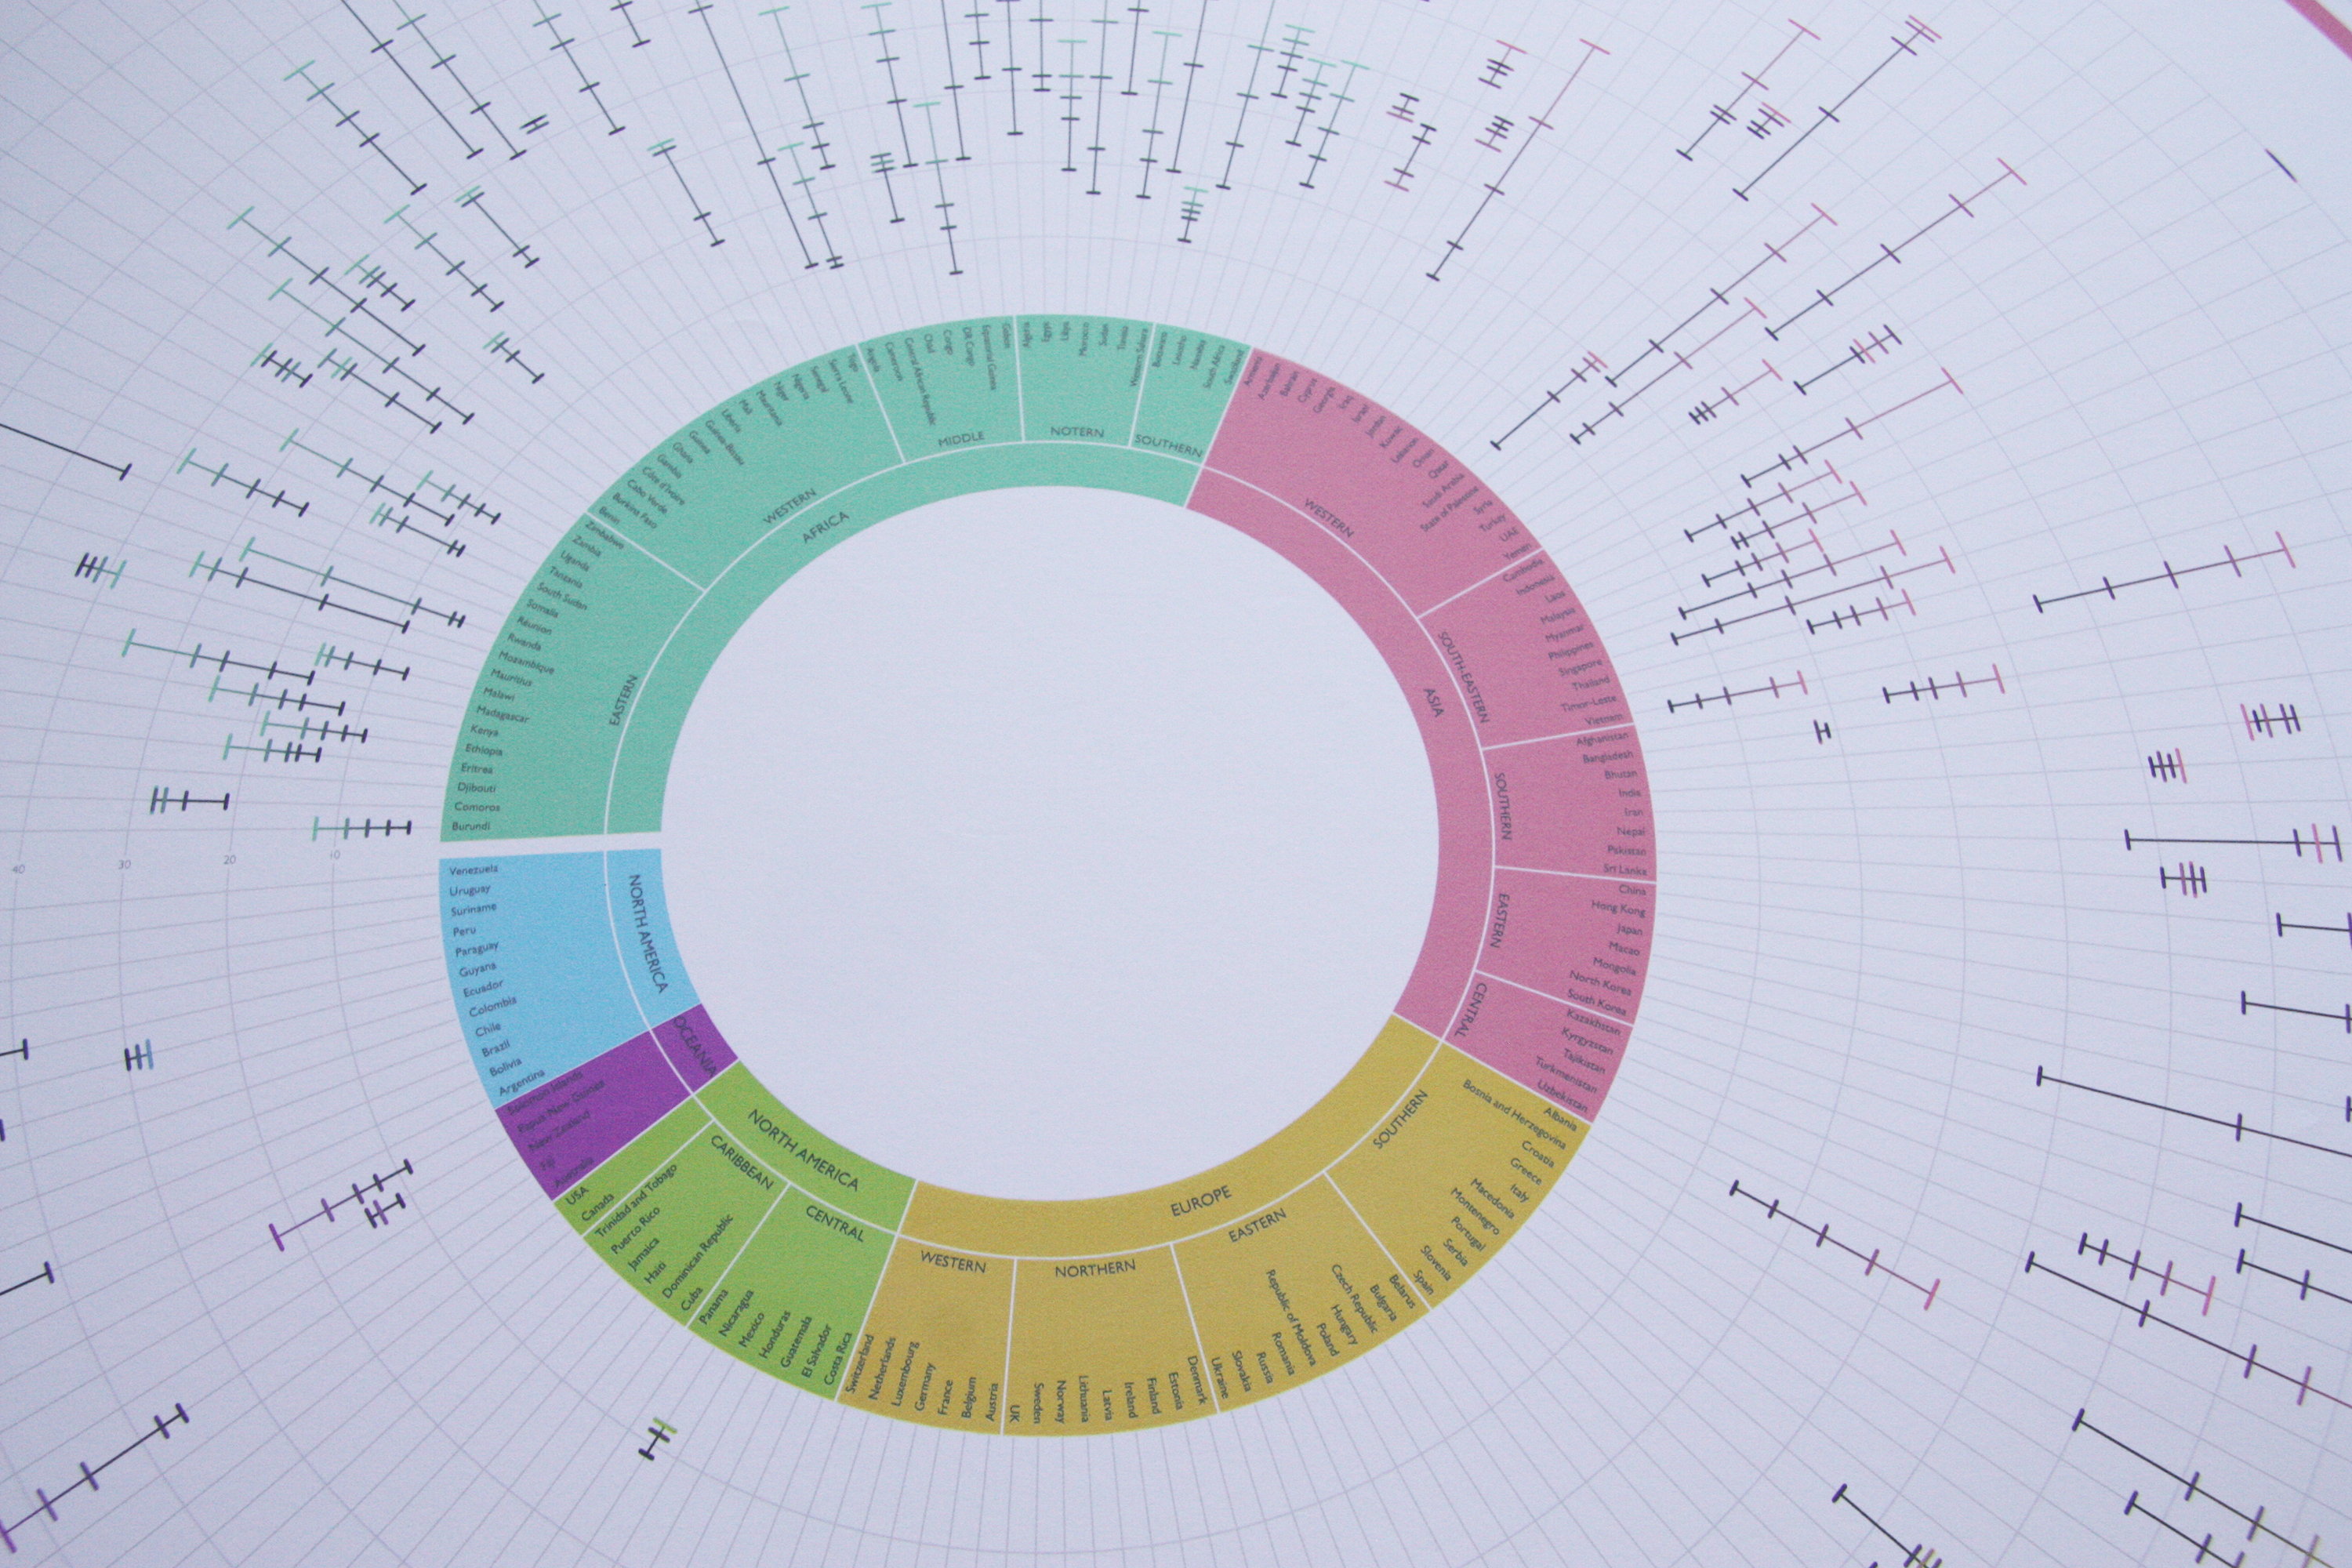
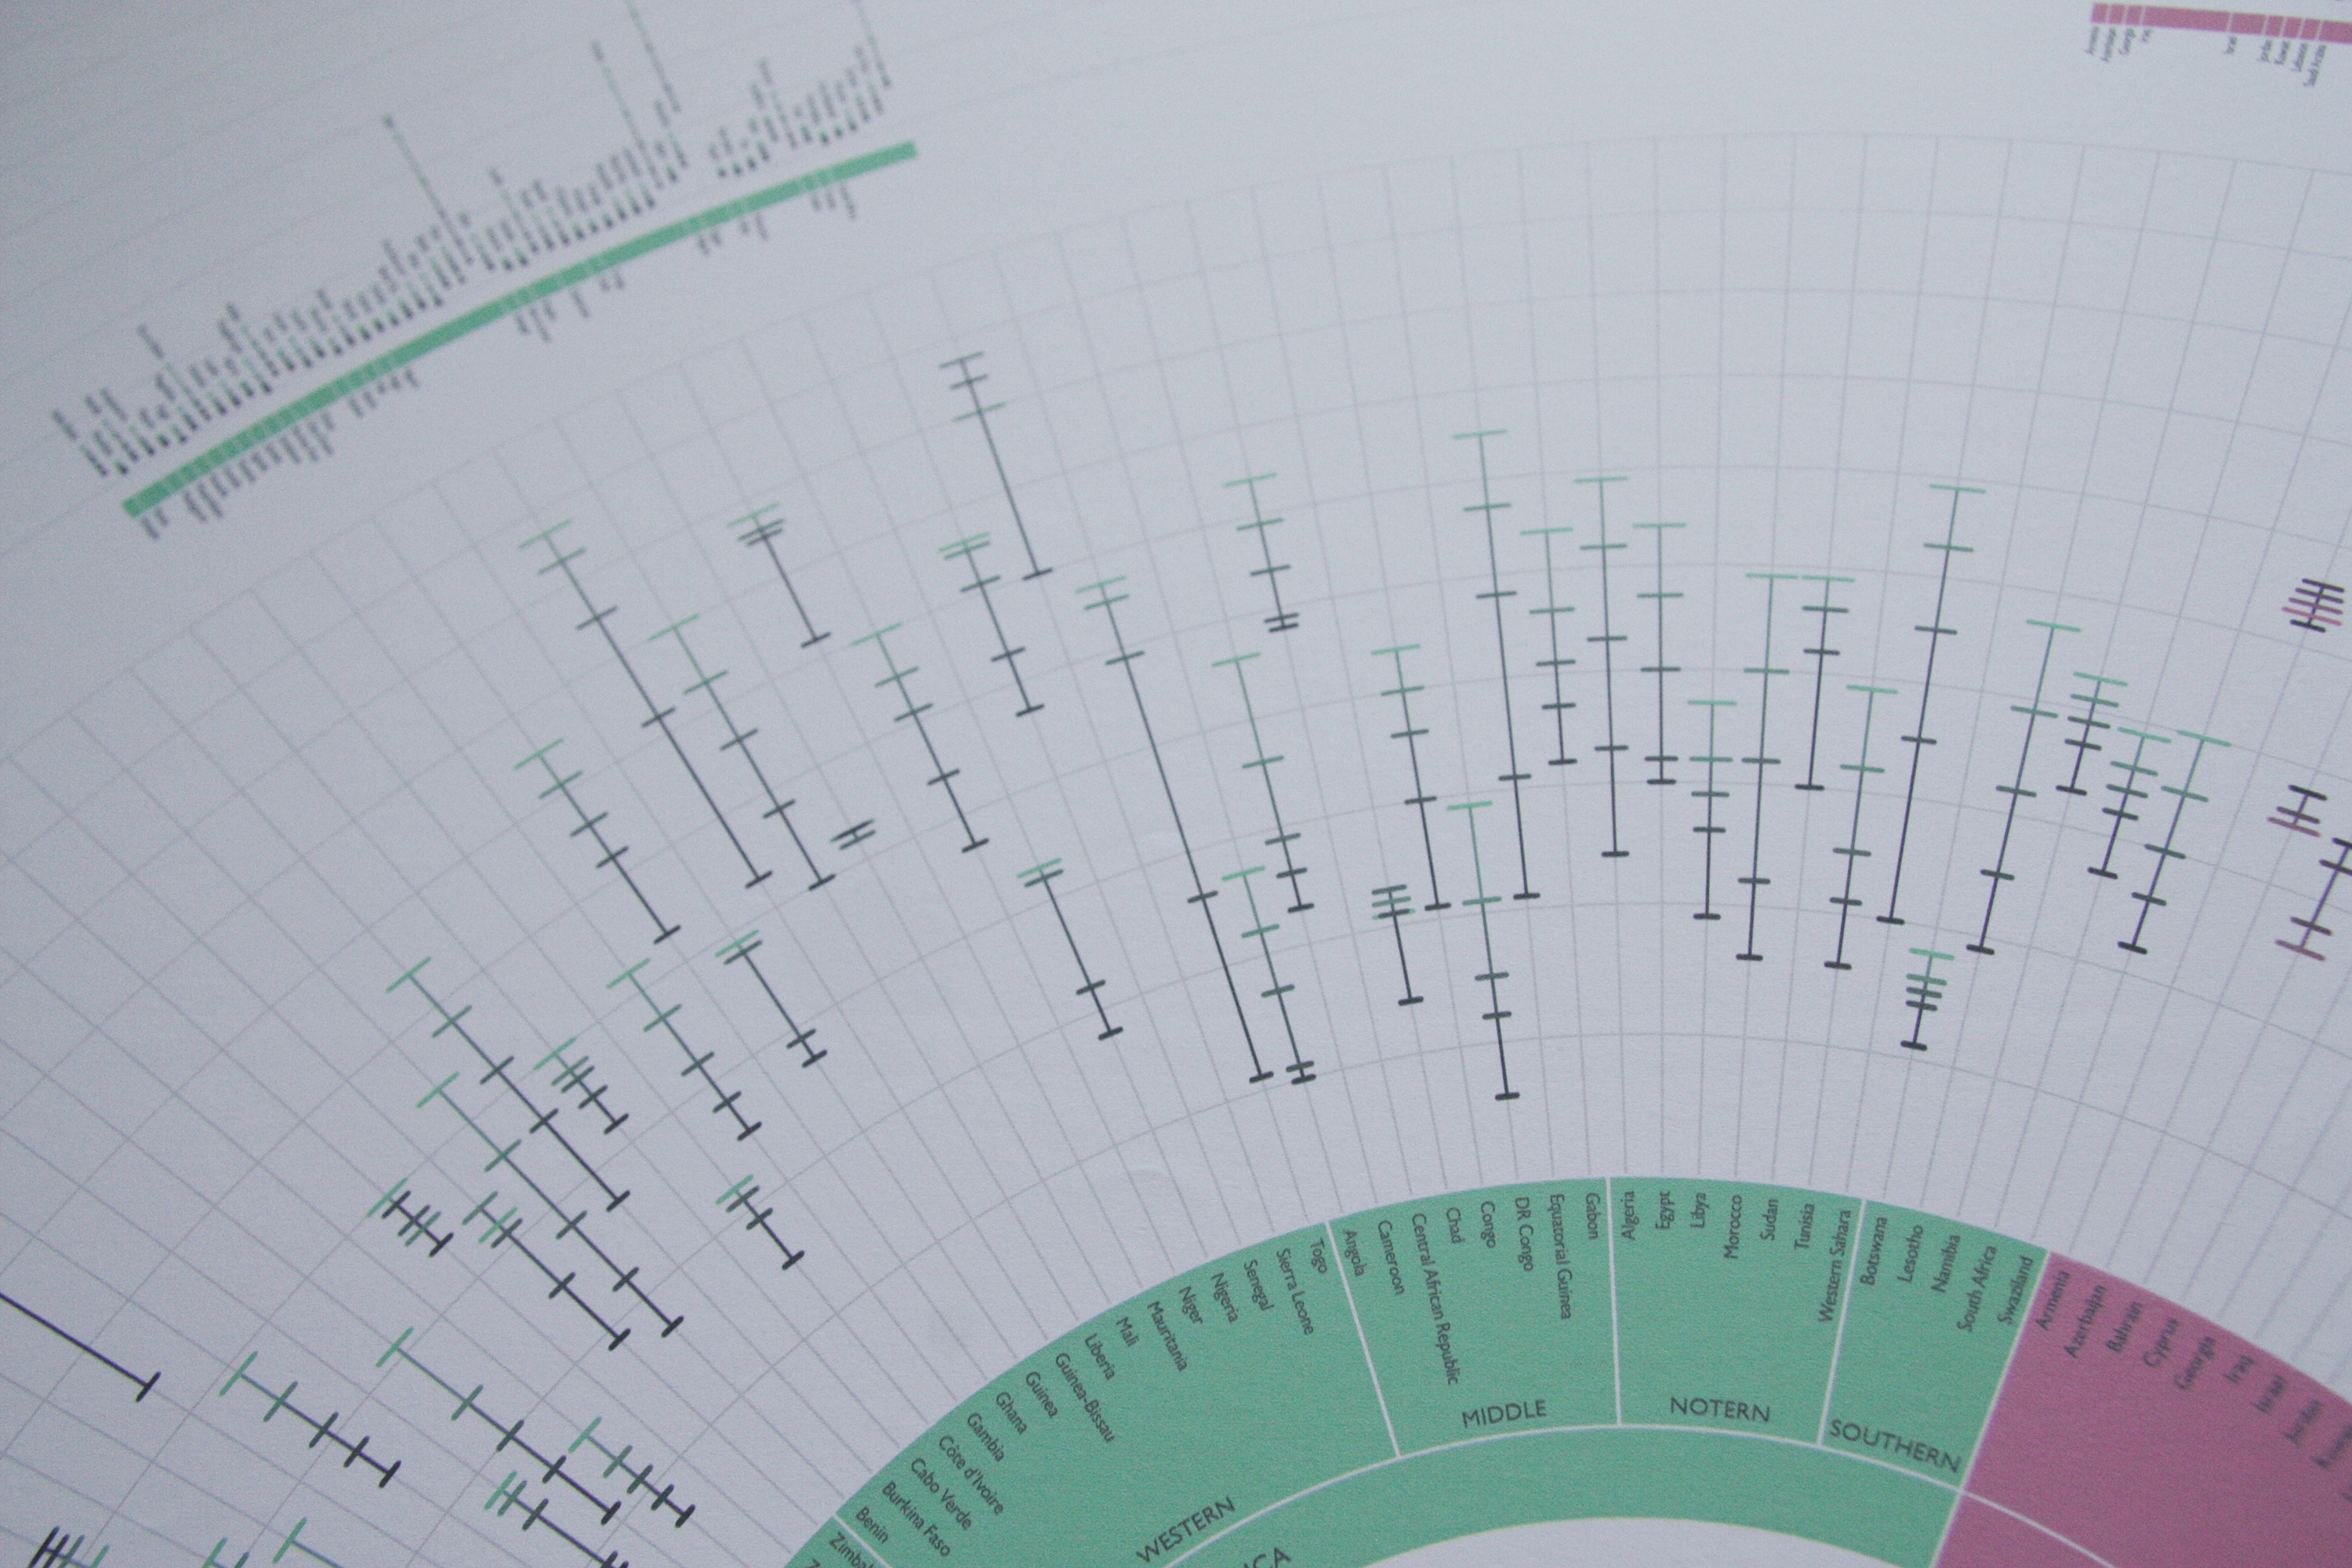
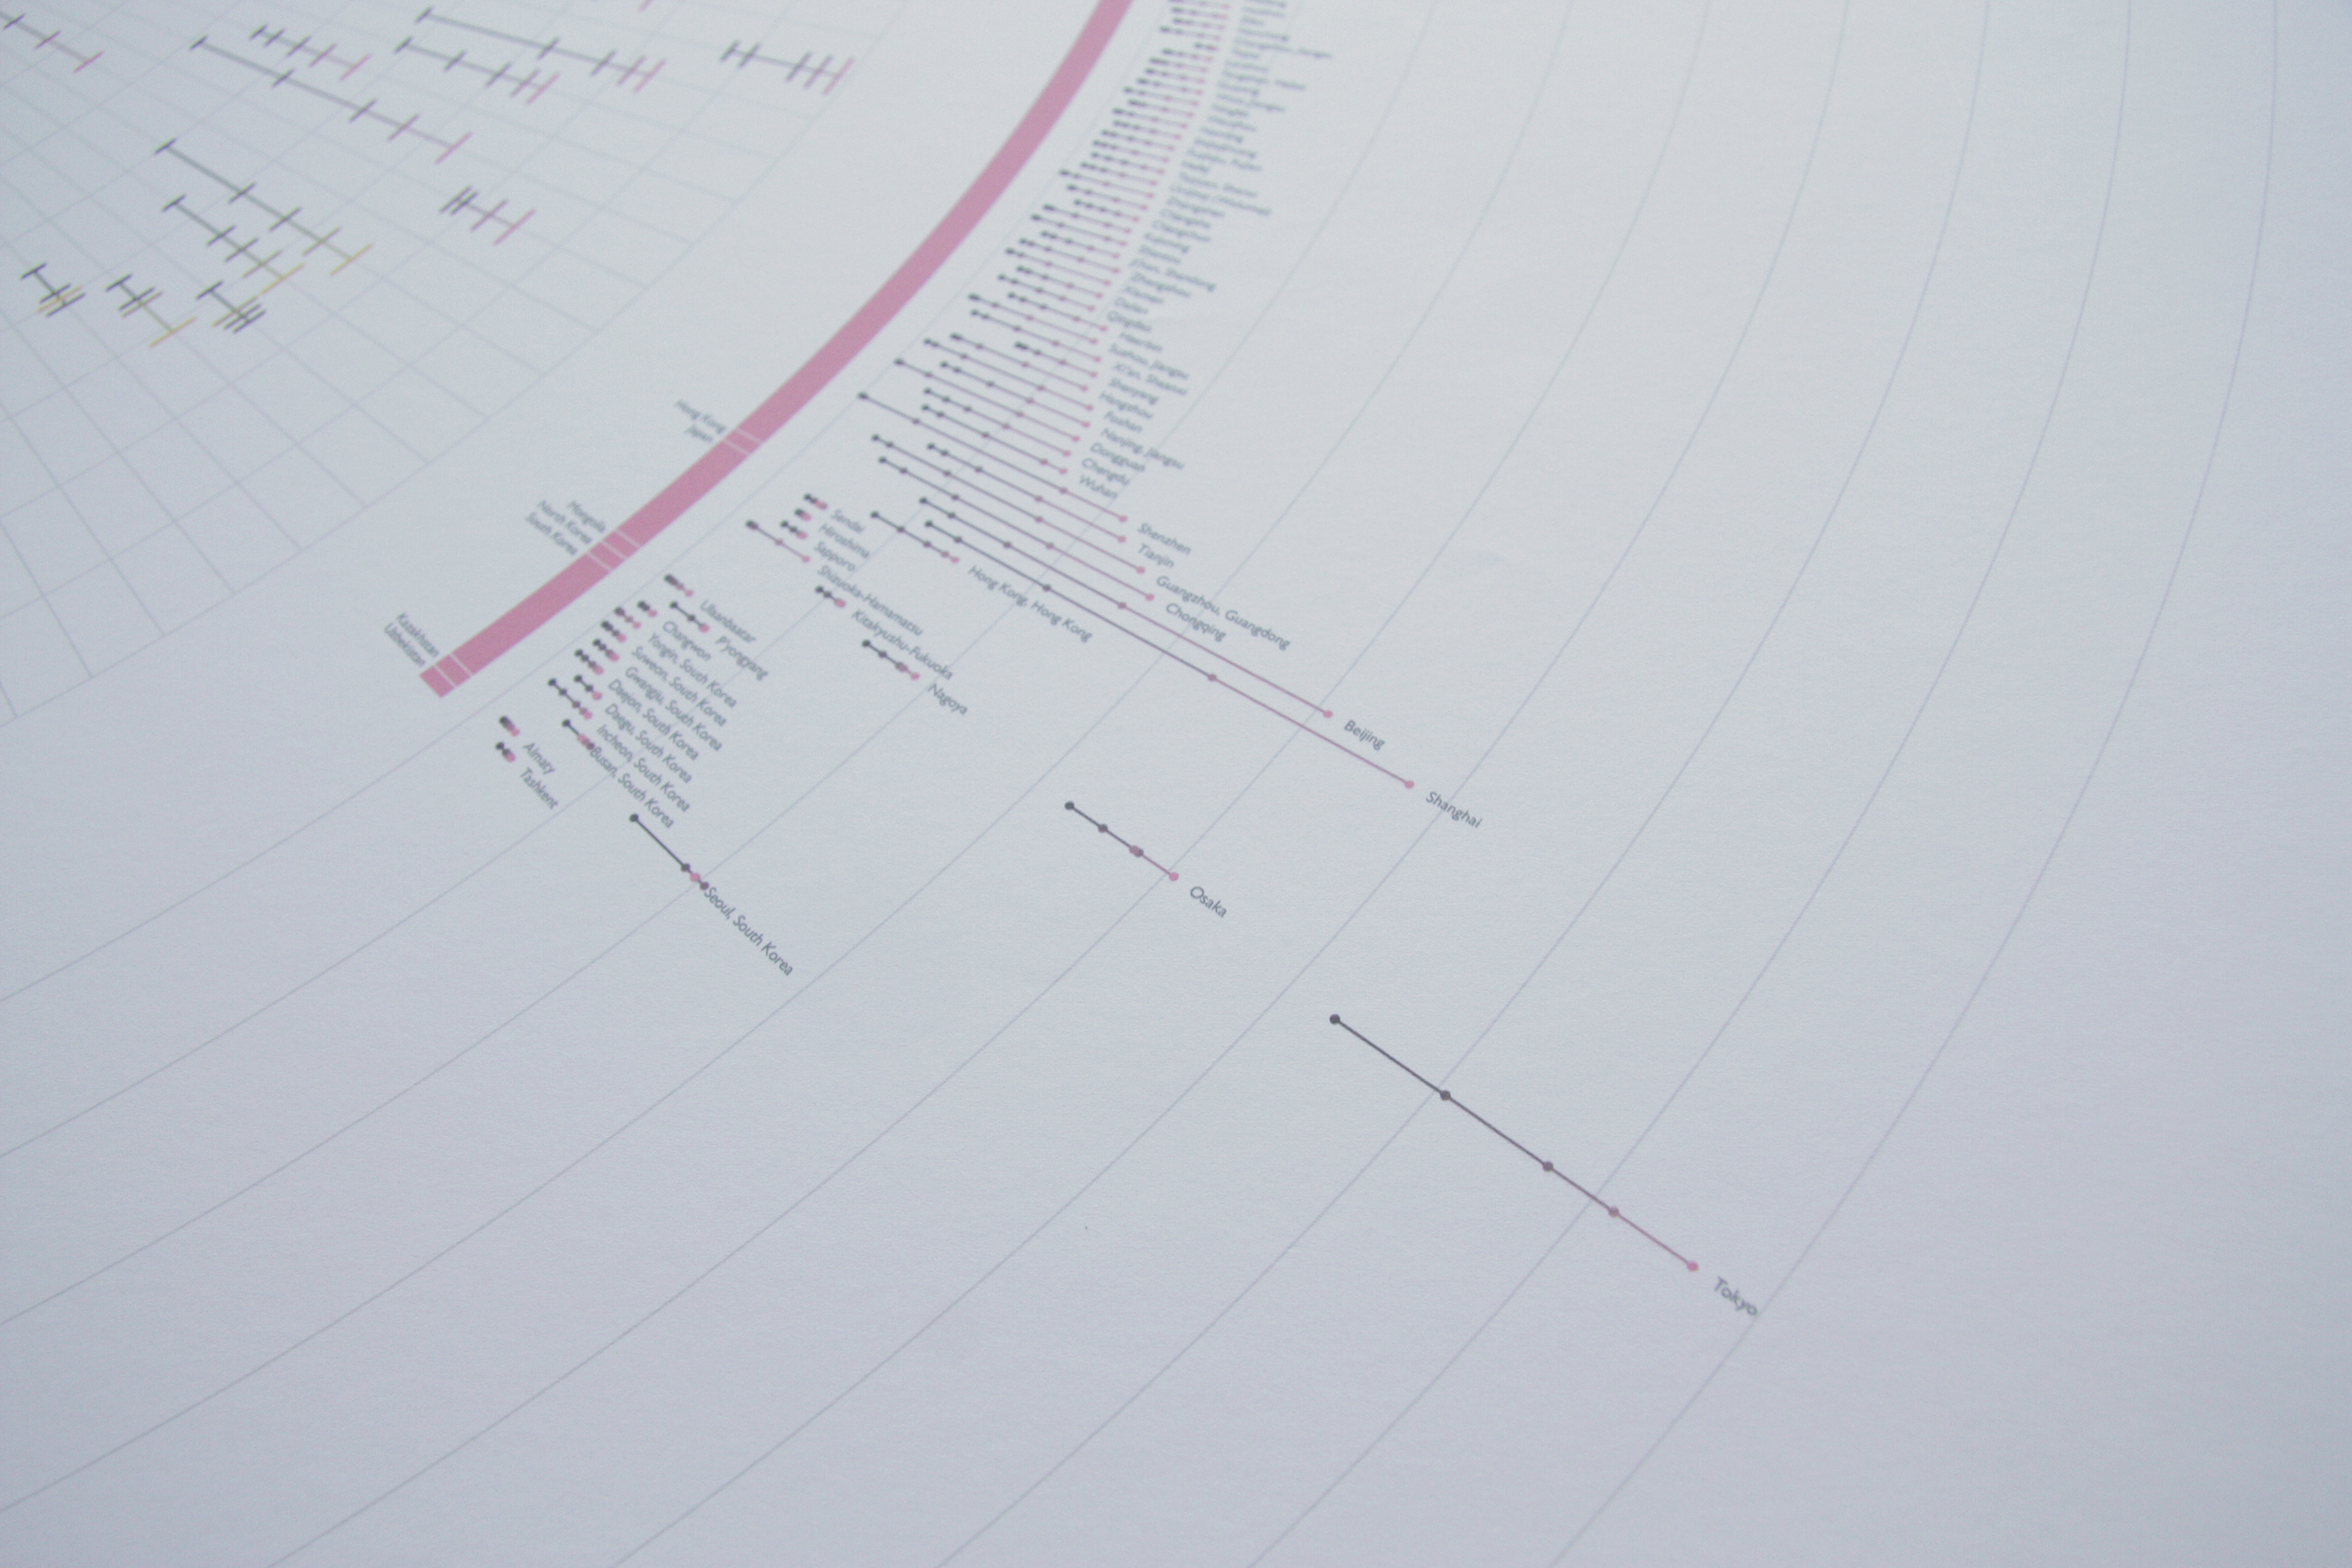
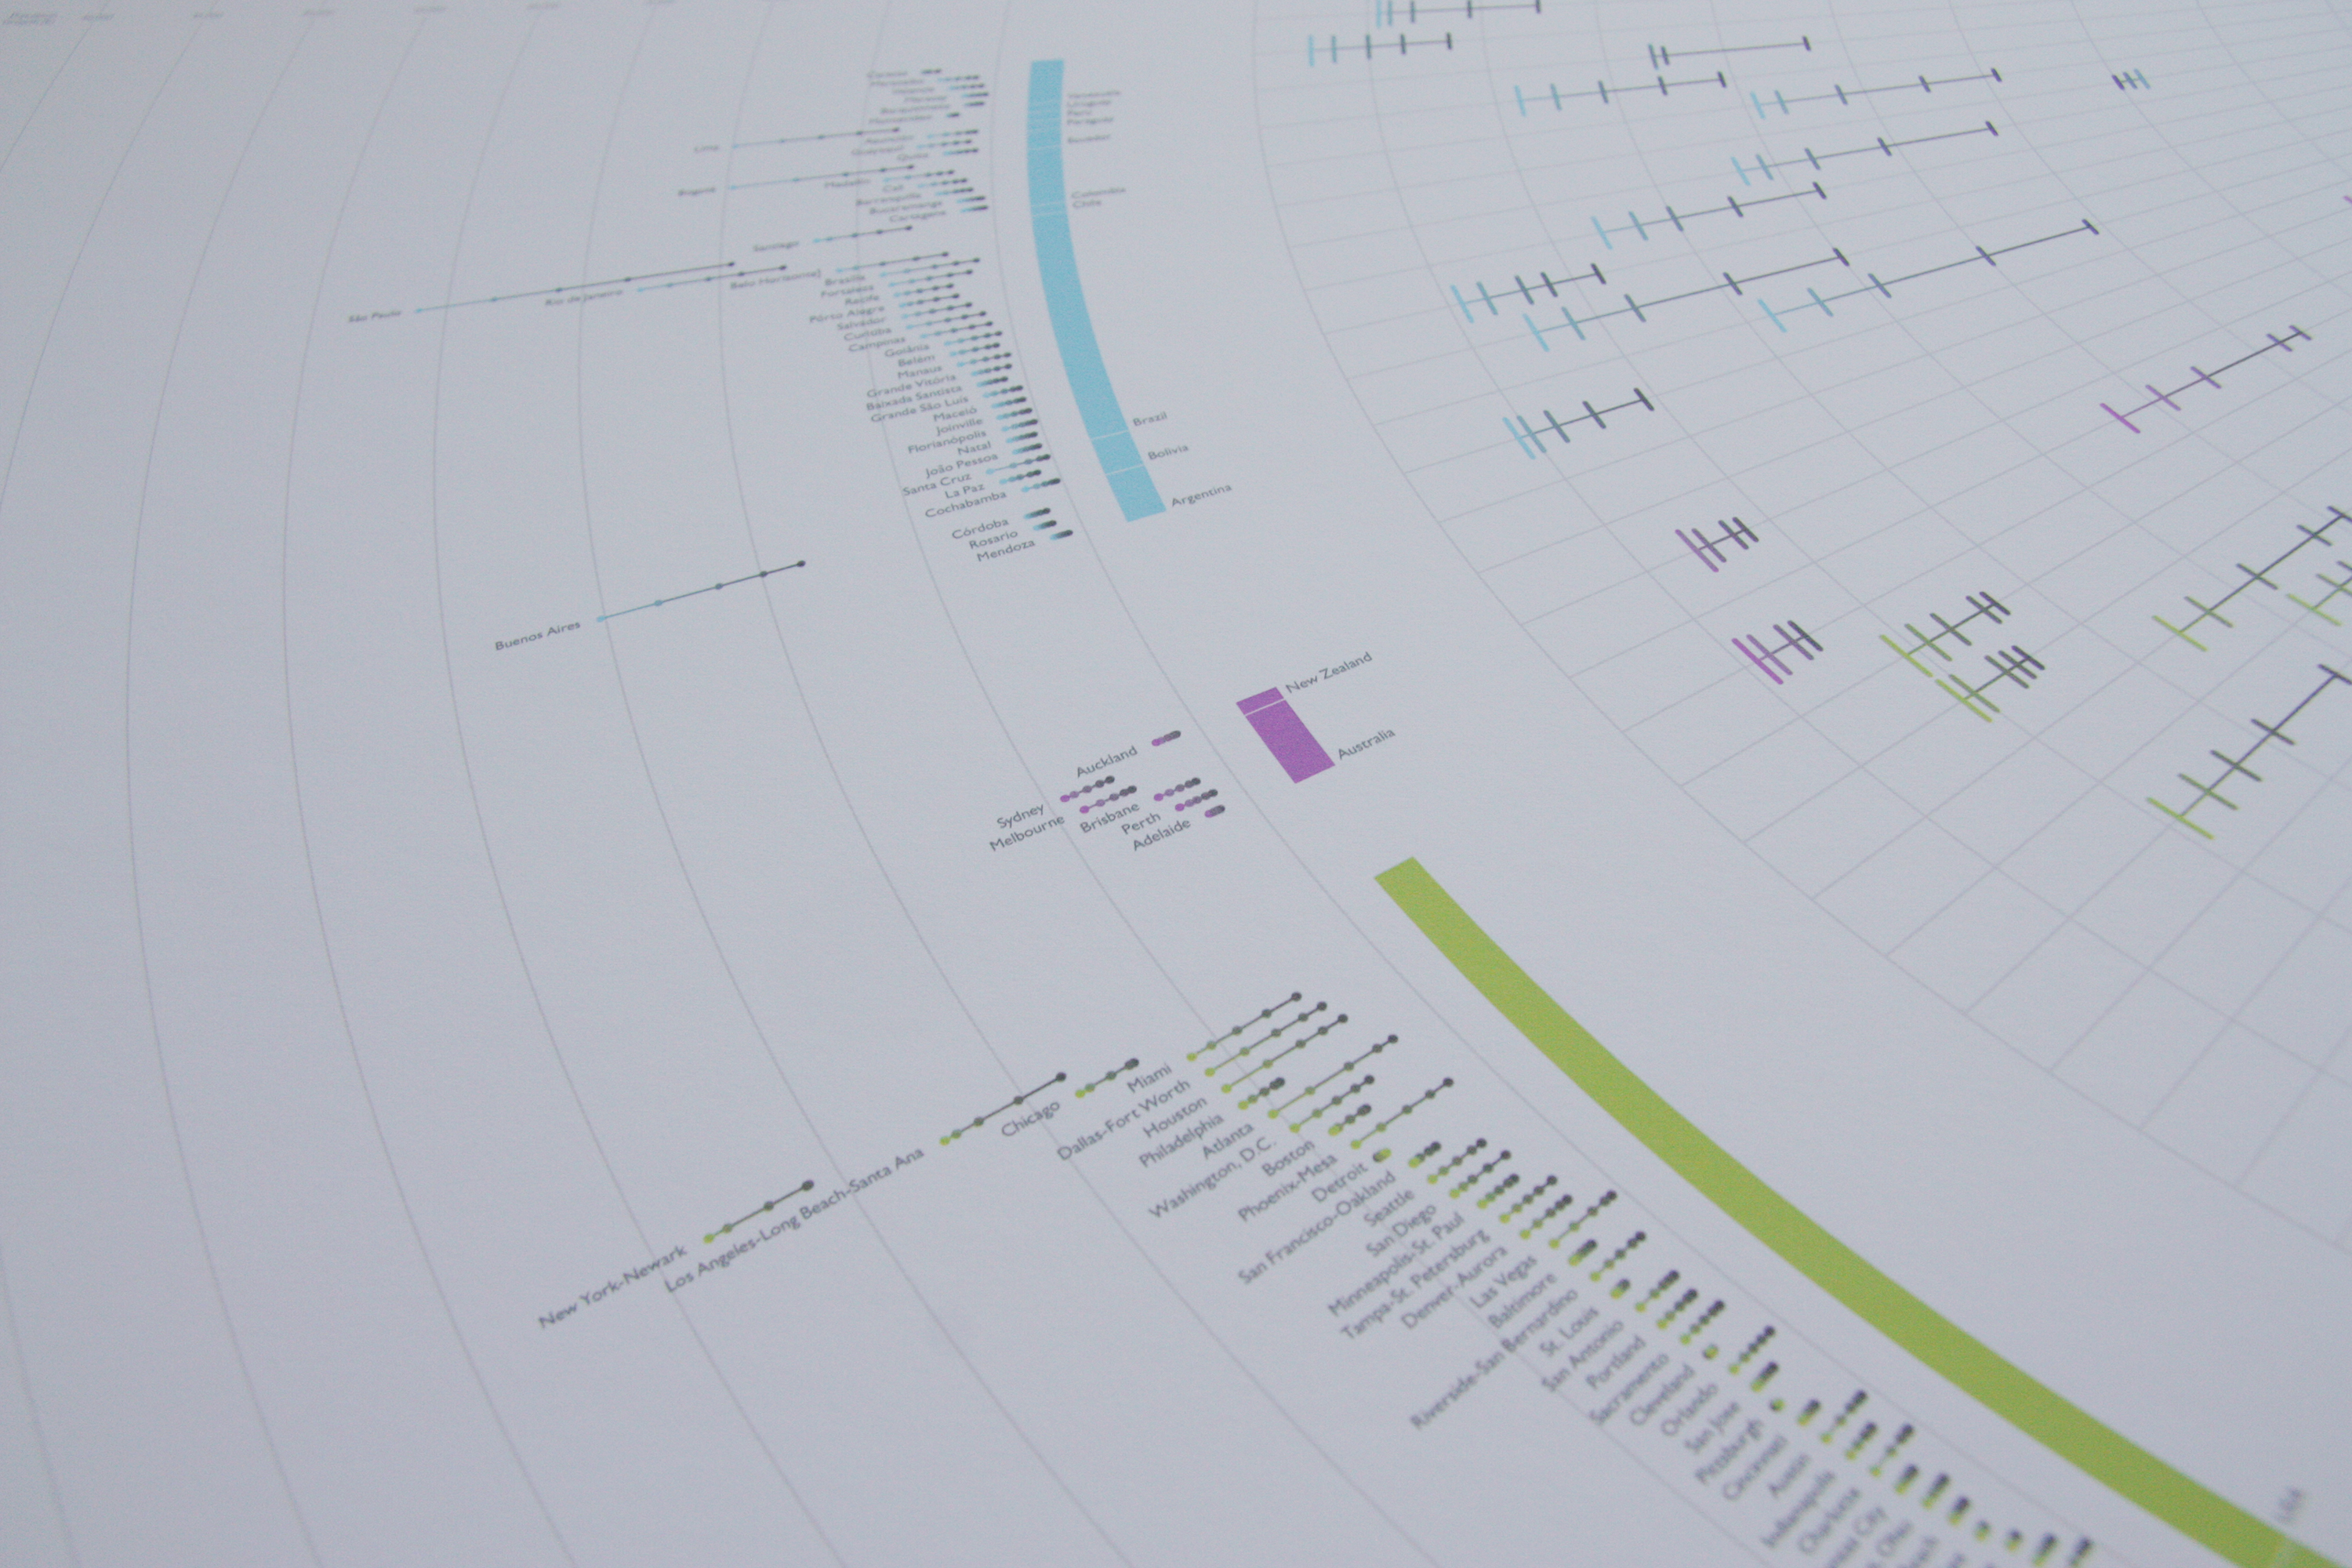
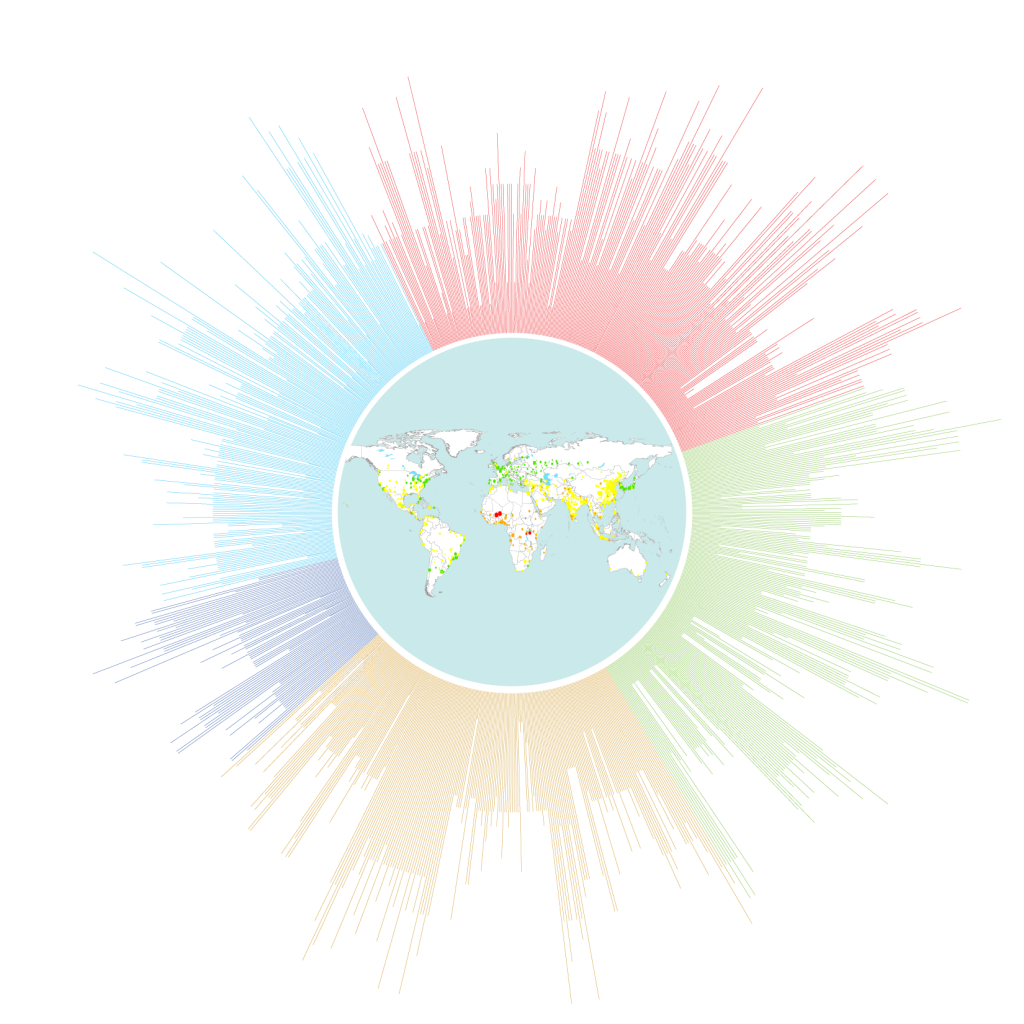
Cities we live in shows visualized data regarding changes in both urbanization proportions of all the countries with 500,000 inhabitants or more, and top 500 biggest urban agglomerations of every decade from 1975 to 2015. This project was initiated from my interest towards urbanism, and I wanted the final poster would reflect how much one city has been expanded in terms of its population. The first thing I did was visualizing the data of populations in the top biggest 1000 cities. I was able to compare the growth, as well as the rare decline, of each city; however, the problem I encountered was that the changes of many cities were not very recognizable except a few massive cities. So, I’ve decided to cut down the list of cities to 500 and added broader information of it, which is urbanization proportion of each country. As a result, it is better execution because it shows the different sense of urbanization when it comes to either city or country. For instance, Australia has a slightly higher nationwide proportion of urbanization than USA, while USA has more big cities than Australia.

Little Big Data Proposal + Proof of Concepts

Discovery / Proposal

Subject

For this assignment, I want to visualize a set of data that represents my current area of interests about urbanism and issues in urban areas. I’ve decided to research on data concerning the particular interests I have because when I researched about data visualization for the second assignment, which was about livability of cities, I was wondering if there was a link between the livability and the scale of each city. I think this is worth questioning because, at least to me, it is assumable that people would expect better livability when it comes to big cities, and this supposition could support the reason why one city grows: better living conditions. My poster of data visualization will show the growth or decline rate of population of each city, and any relatable facts that explain such growth and decline.

Data

I found my primary data about Population of Urban Agglomerations published by The Population Division of United Nation. The data collects every city that has more than 300,000 habitants in 2014, and shows periodical growth or decline from 1950 to 2030. The data is estimated from the most current available census or official population estimate of each country. Even though I was not able to find livability data for all the cities nor other citywide data as vast as the one that I already found, I could connect one secondary nationwide data that explains increase or decrease of population of each city within the nation.

Tool and Approach

The data is very neatly organized and able to be simply altered to a csv file, so I don’t need something else to do for the data arrangement. Besides, I will mainly use both Processing to visualize data and Adobe Illustrator to edit visualization. In order to explore the best way of visualization that can be visually appealing and precisely executed, I might need to sketch out several ideas of visualization before moving on to the Processing part, although the possible visualization concept would be either mapping out on a map, or lining up and spreading out on a circular line.

Comp

comp 1comp

comp 2comp(detailed view) 


 Proof of Concepts

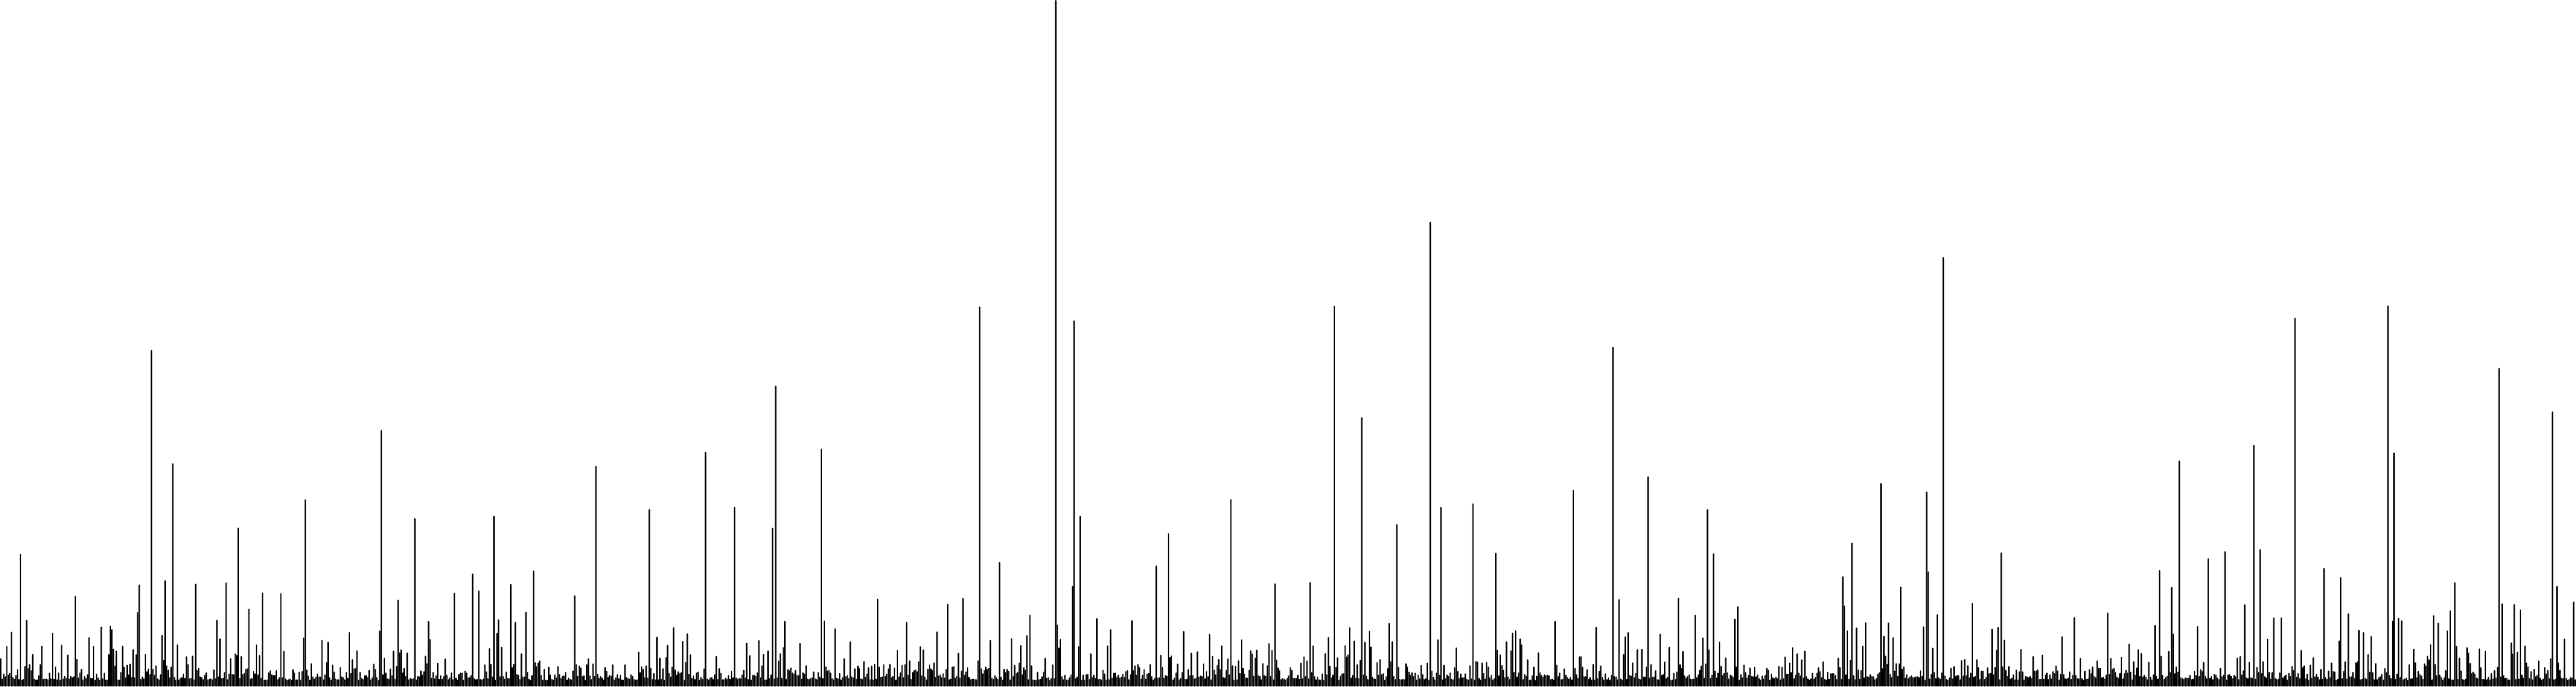
First, I was able to get a population data from a csv file, and draw lines that represent corresponding cities. I made a “drawLine” function and wanted the lines to be spreading out on circular direction. But the data is too vast to be spread out because the angle to rotate the matrix is too small. So I just lined them up for now.

POC

pdf POC

code POC1


Code Warm Up Part 2

7f8d5e92c0f76e5fcd8ed5765ae207ee

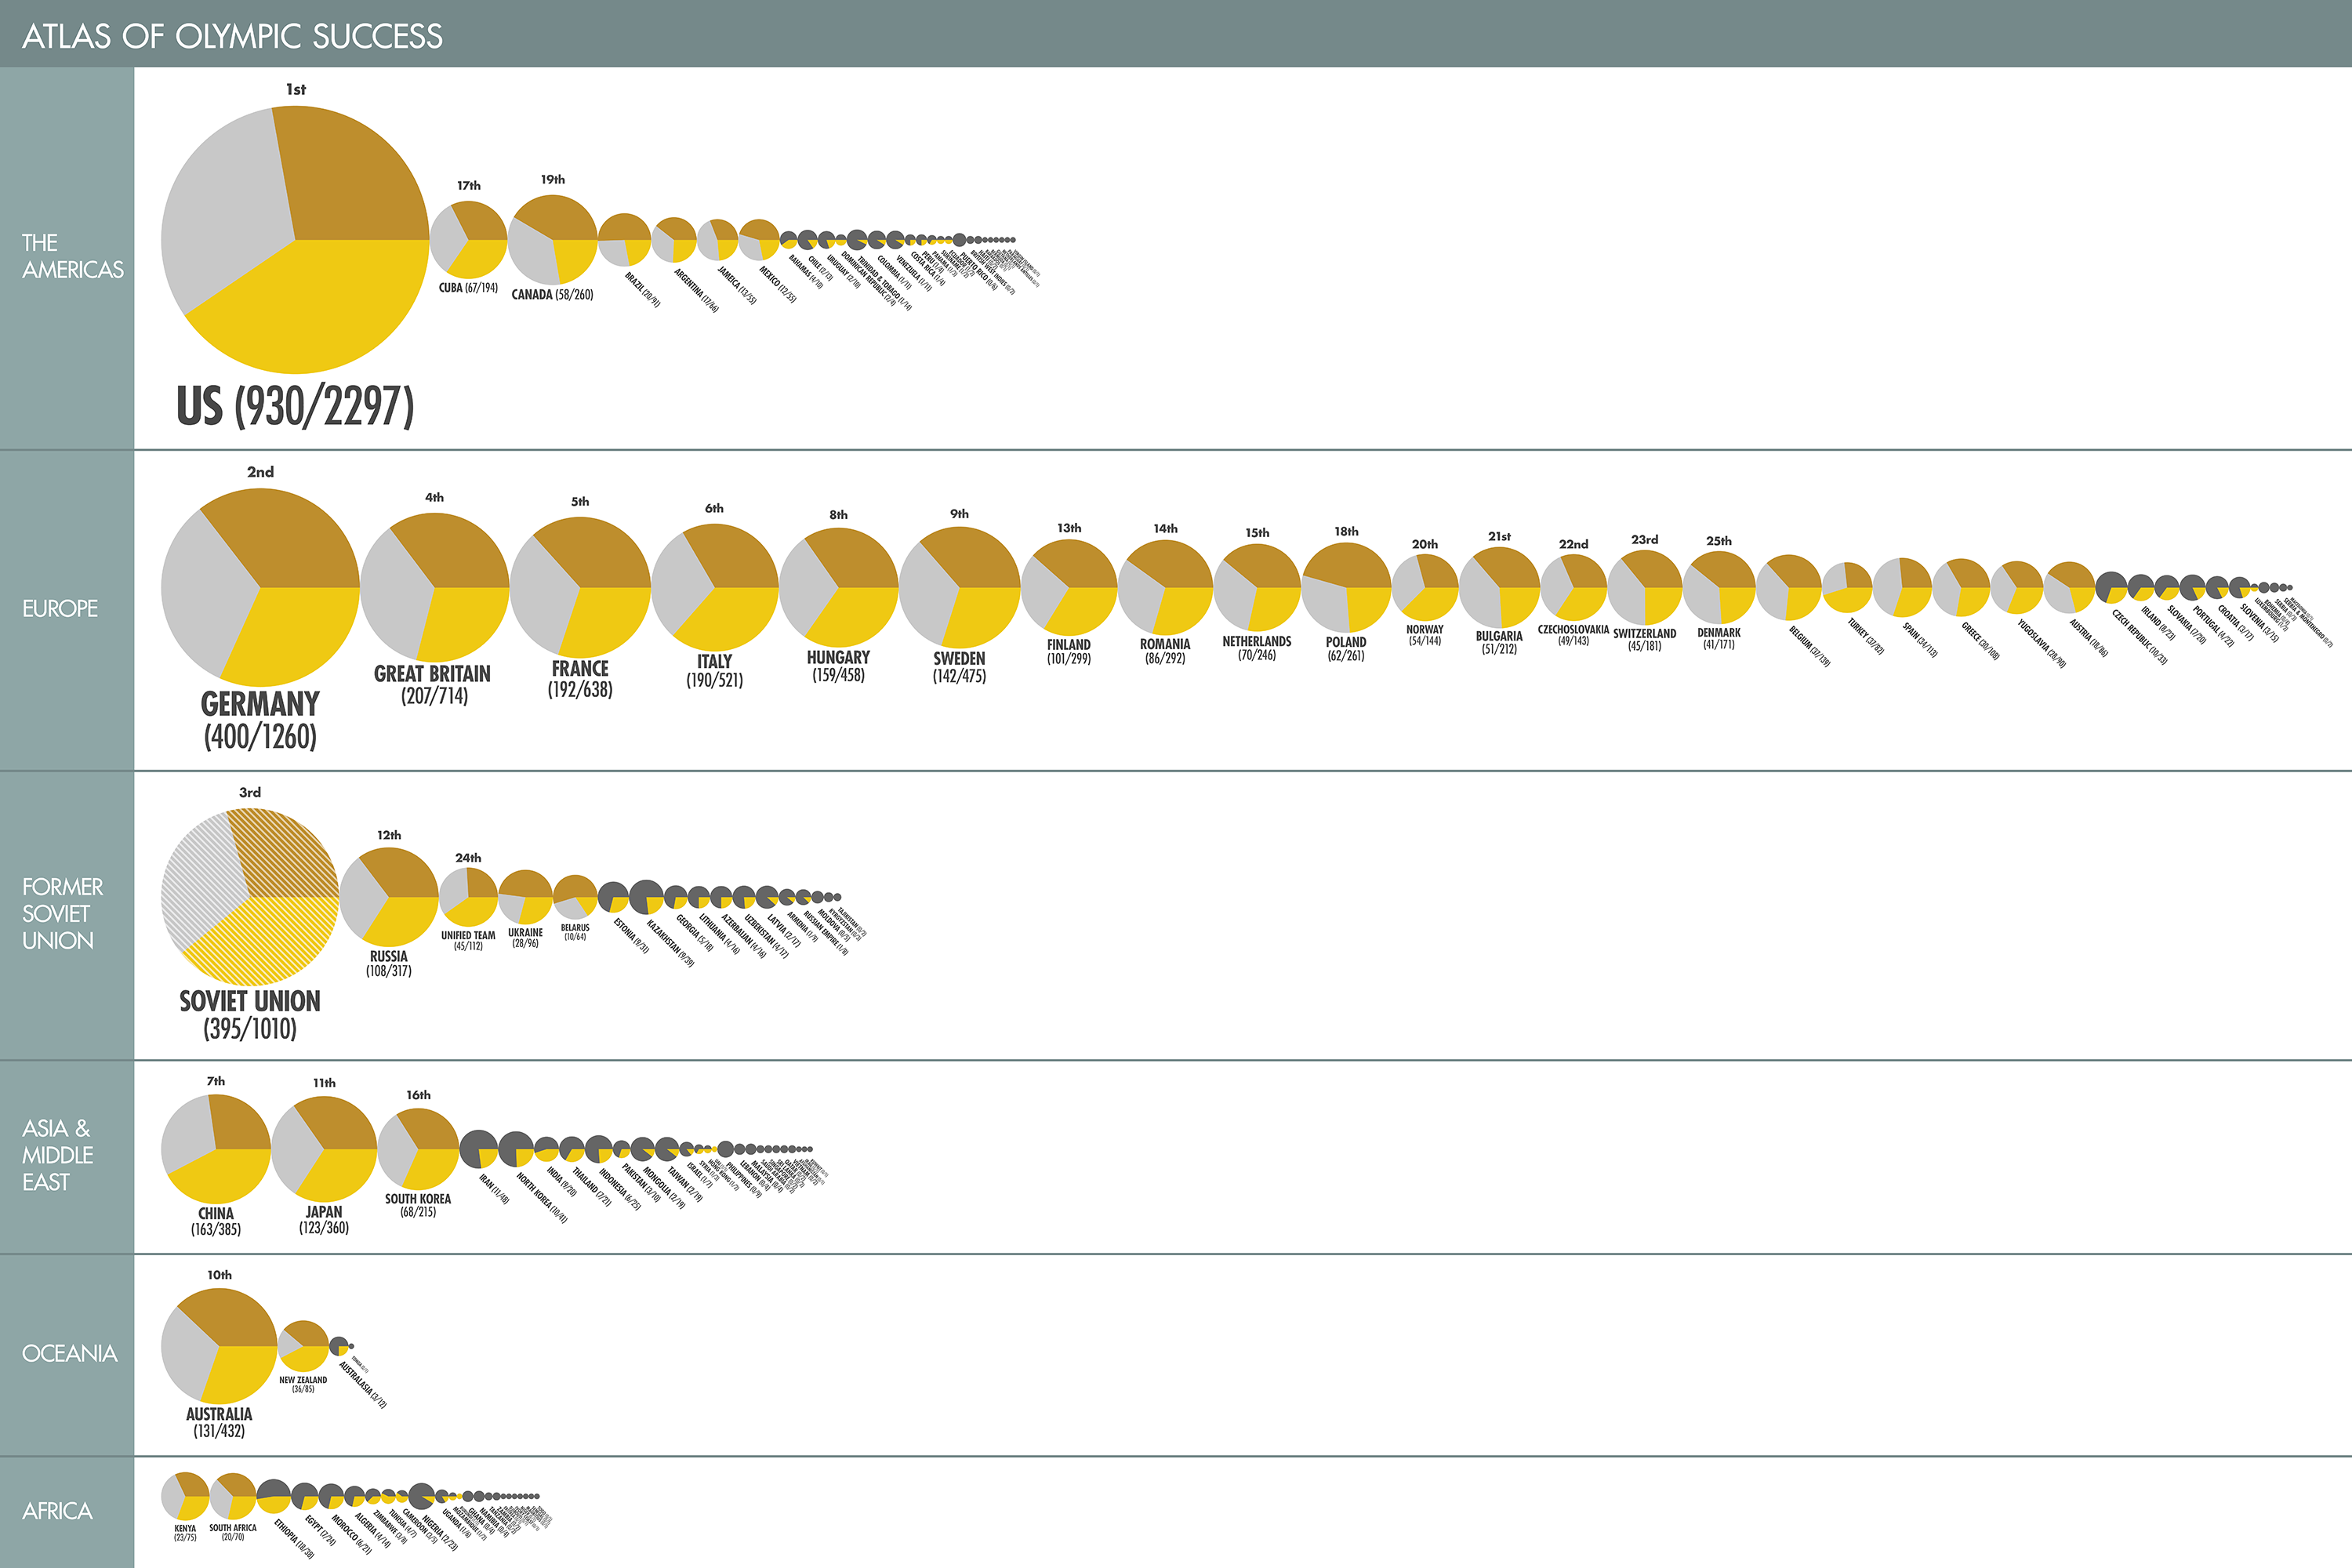
Original data visualization: Atlas of Olympic Success(The Guardian)


after coding After Processing: olympic


after illustratorAfter Illustrator: olympic.pdf


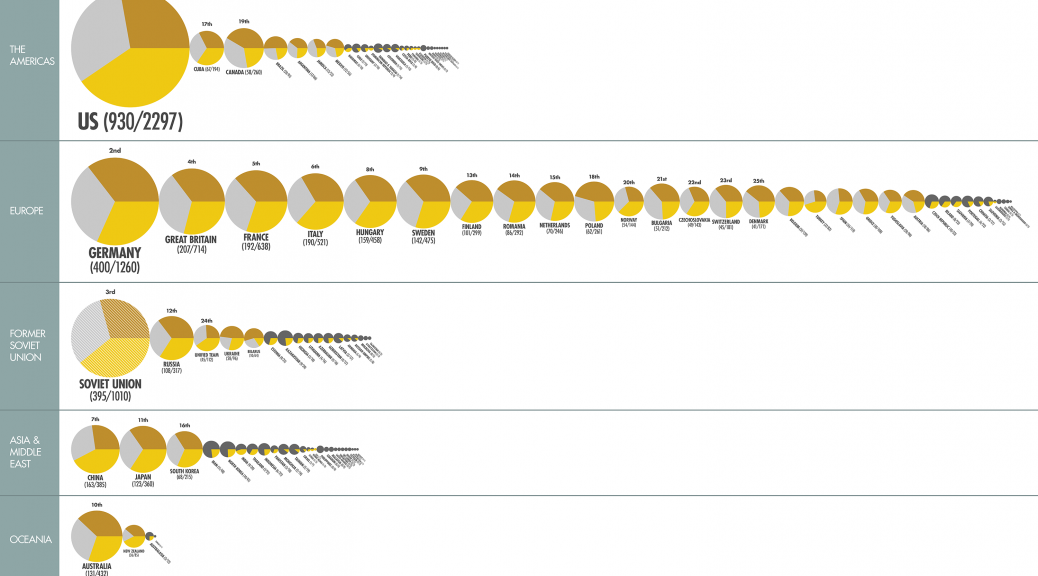
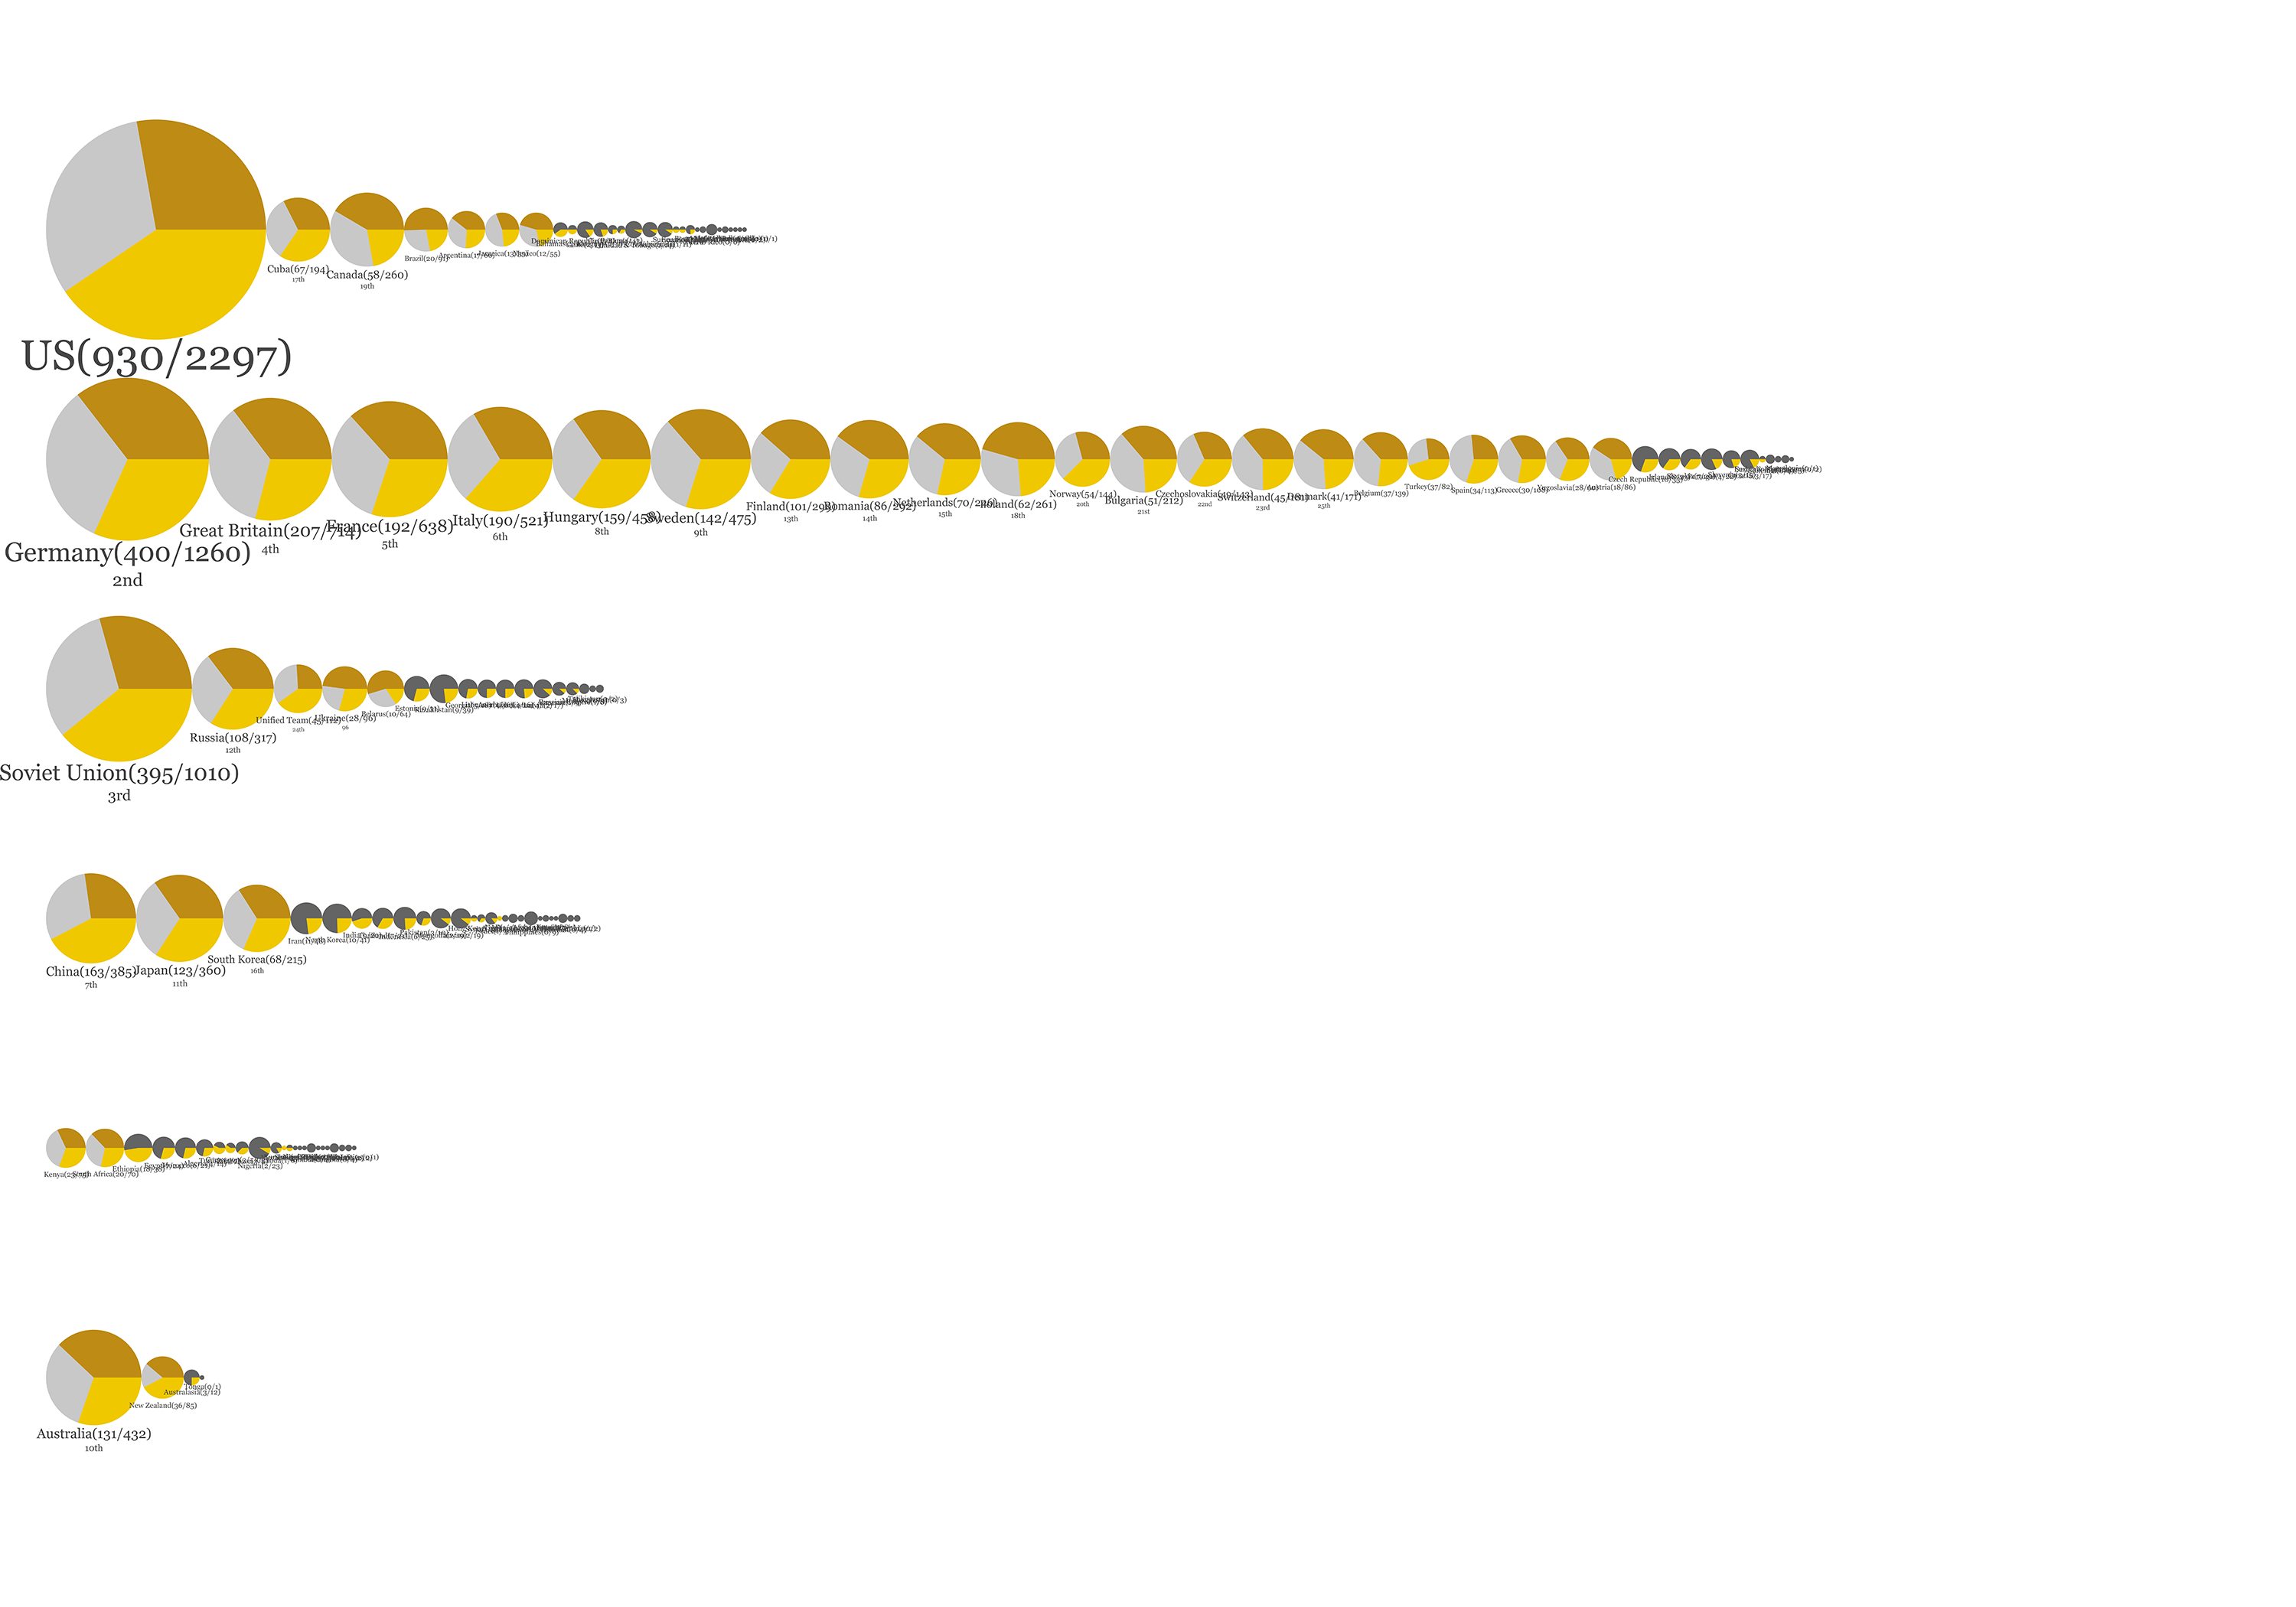
The Guardian visualized how many medals have been won by each country since the beginning of the modern Olympic. The infographic can be simply divided into two parts, and I took out only the upper part which deals with a number of medals each country has been awarded. In the original infographic, the size of each circle represents the number of medals that one country has won, and circles are mapped out according to their geographic location. I keep the circular shape, but instead of showing only gold medals inside the total medals, I broke the circle into three pies which reflect gold medals, silver medals and bronze medals individually. Also, I lined up the circle according continents the countries belong to. I was struggling with leaving texts editable when I exported the code to a pdf file, but I found one example on Google so I made use of it.


Code Warm Up

death original

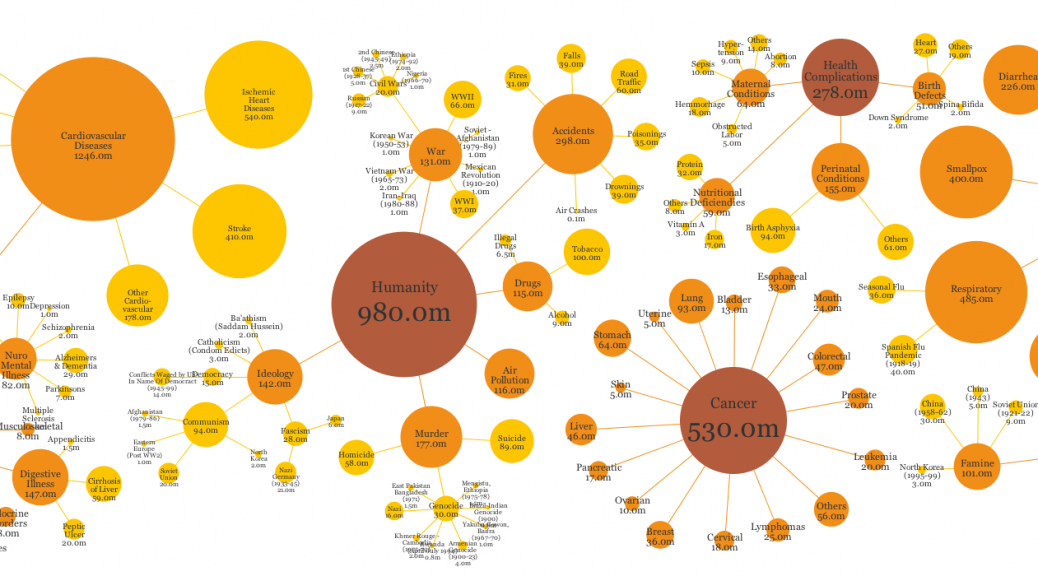
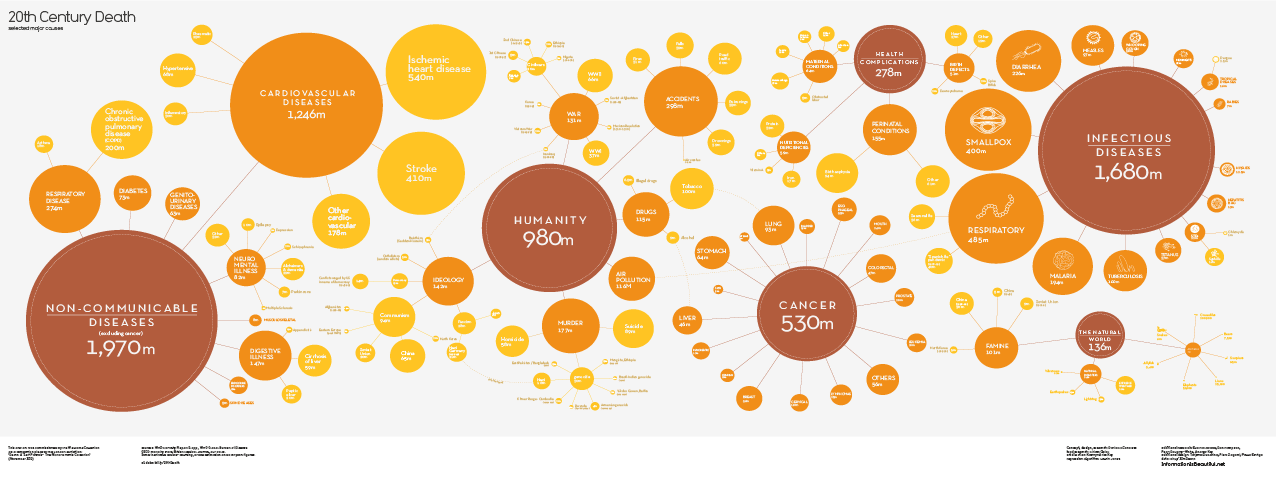
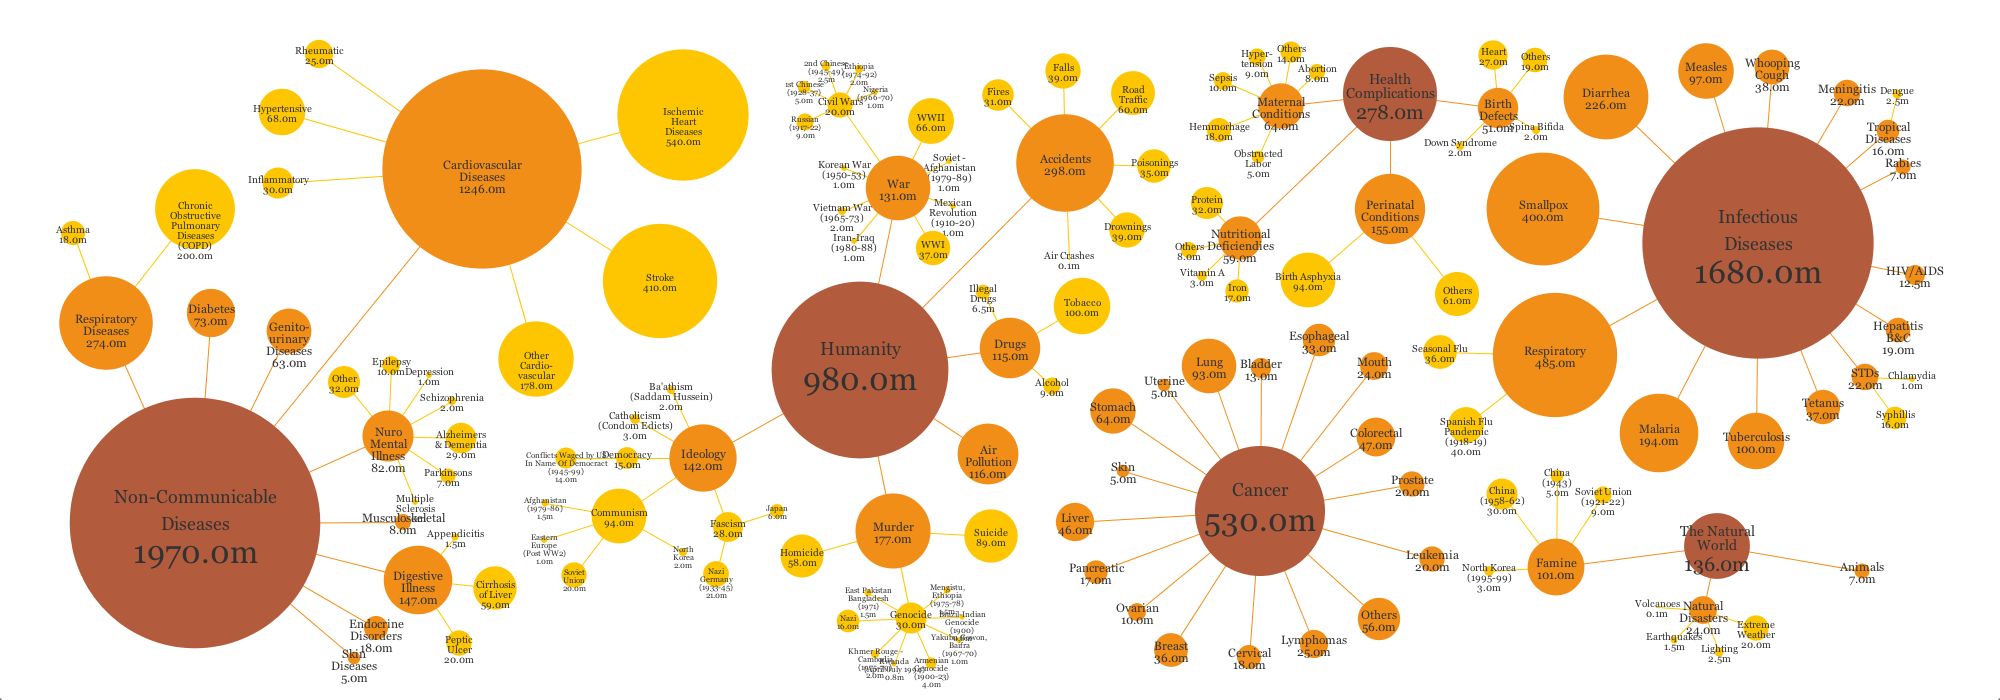
Original data visualization: 20th Century Death (Information Is Beautiful)

death practice

death_practice

The first data visualization I found is certainly interesting, and I thought it would not be very hard to duplicate for practice. It was not very difficult, but quite demanding because I needed to generate circles and position them separately. Even though I tried to make mine as similar as the original one, there are some differences. Some of them was were my intention because I found that the sizes of the circles in the original data visualization don’t seem very precise, so I resized them a little bit. However, I was not able to reposition some overlapped labels because it was hard to adjust each of them one by one when I made them with functions.


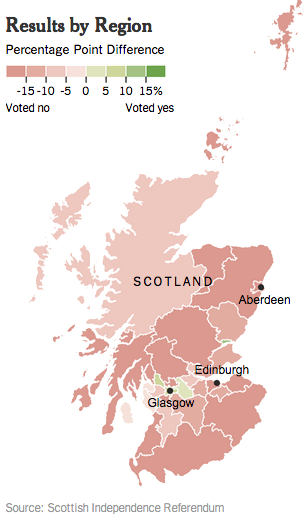
scotland vote original

Original data visualization: Scotland Independence Vote Results by Region (New York Times)

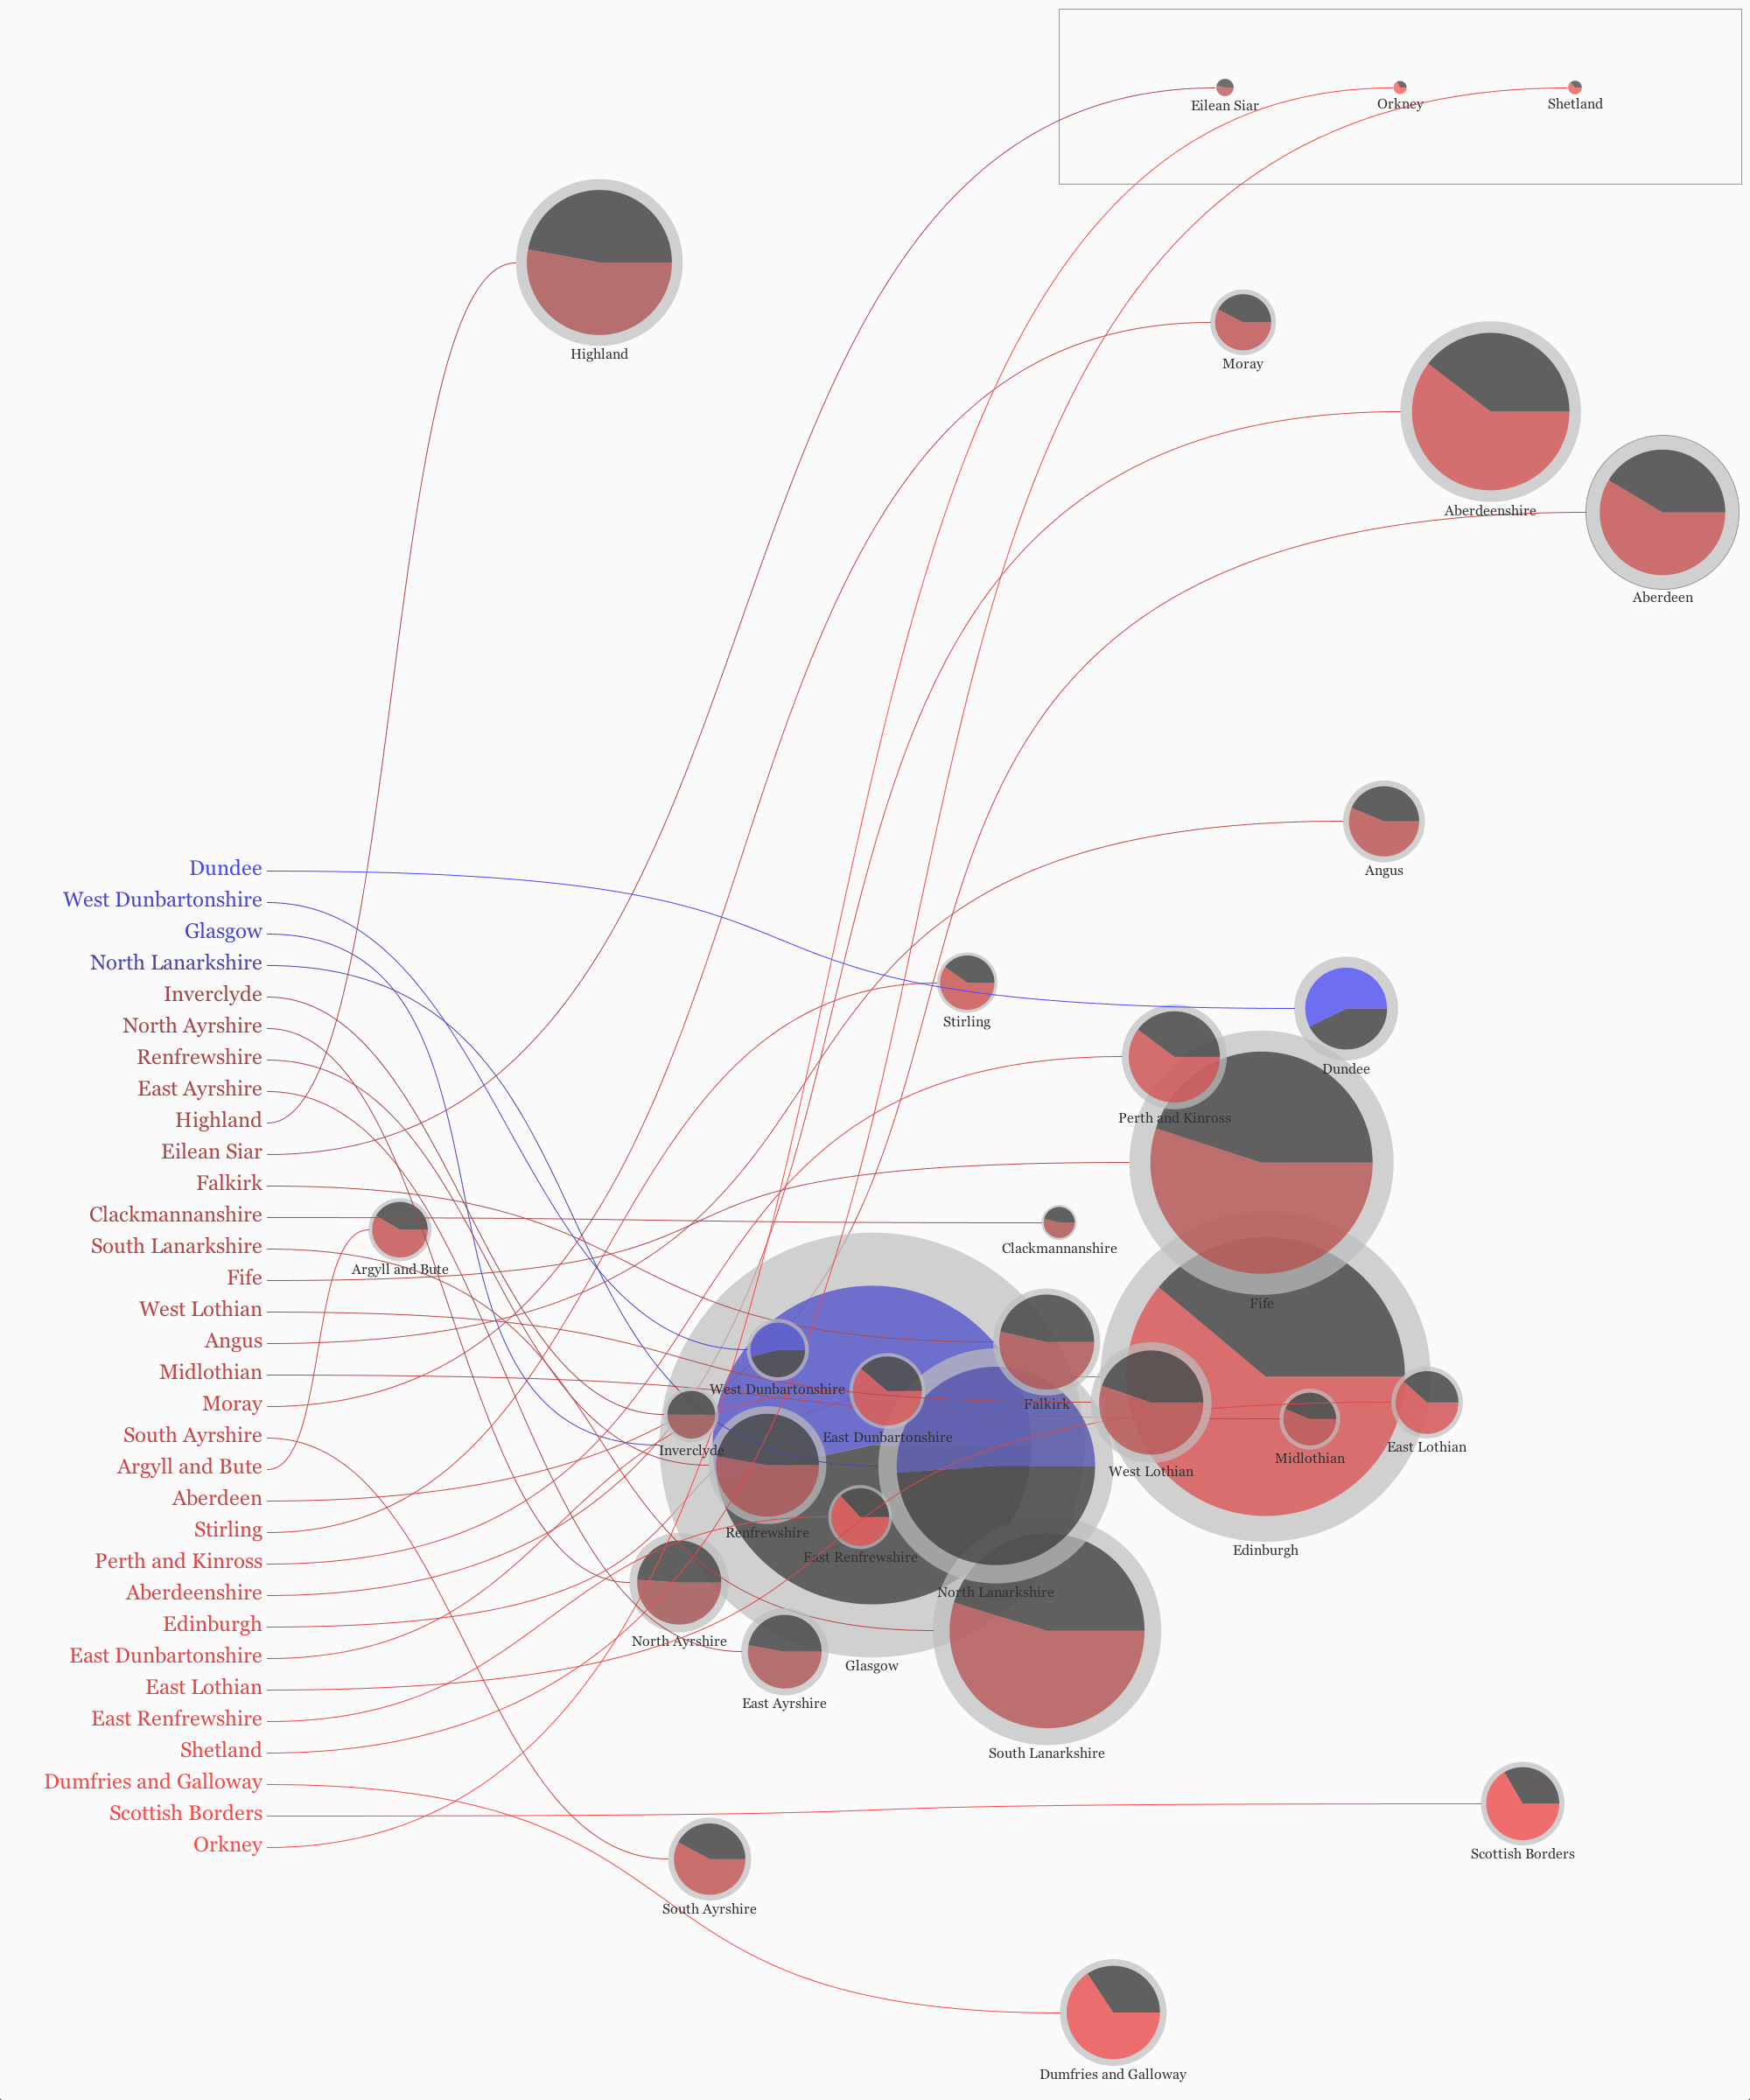
scotland vote practice

scotland_vote_practice

The original data visualization looks very simple and gives a clear message, but it does not provide information regarding a turnout. The heat map seems a proper choice so I kept this, but I changed each map of regions to circular shapes in order to show more detailed information. In the revised one, outer circles represent people entitled to vote, and inner circles represent people who actually voted. Plus, each circle is divided into two parts: one group for independence and the other group against independence.

Makeover Assignment

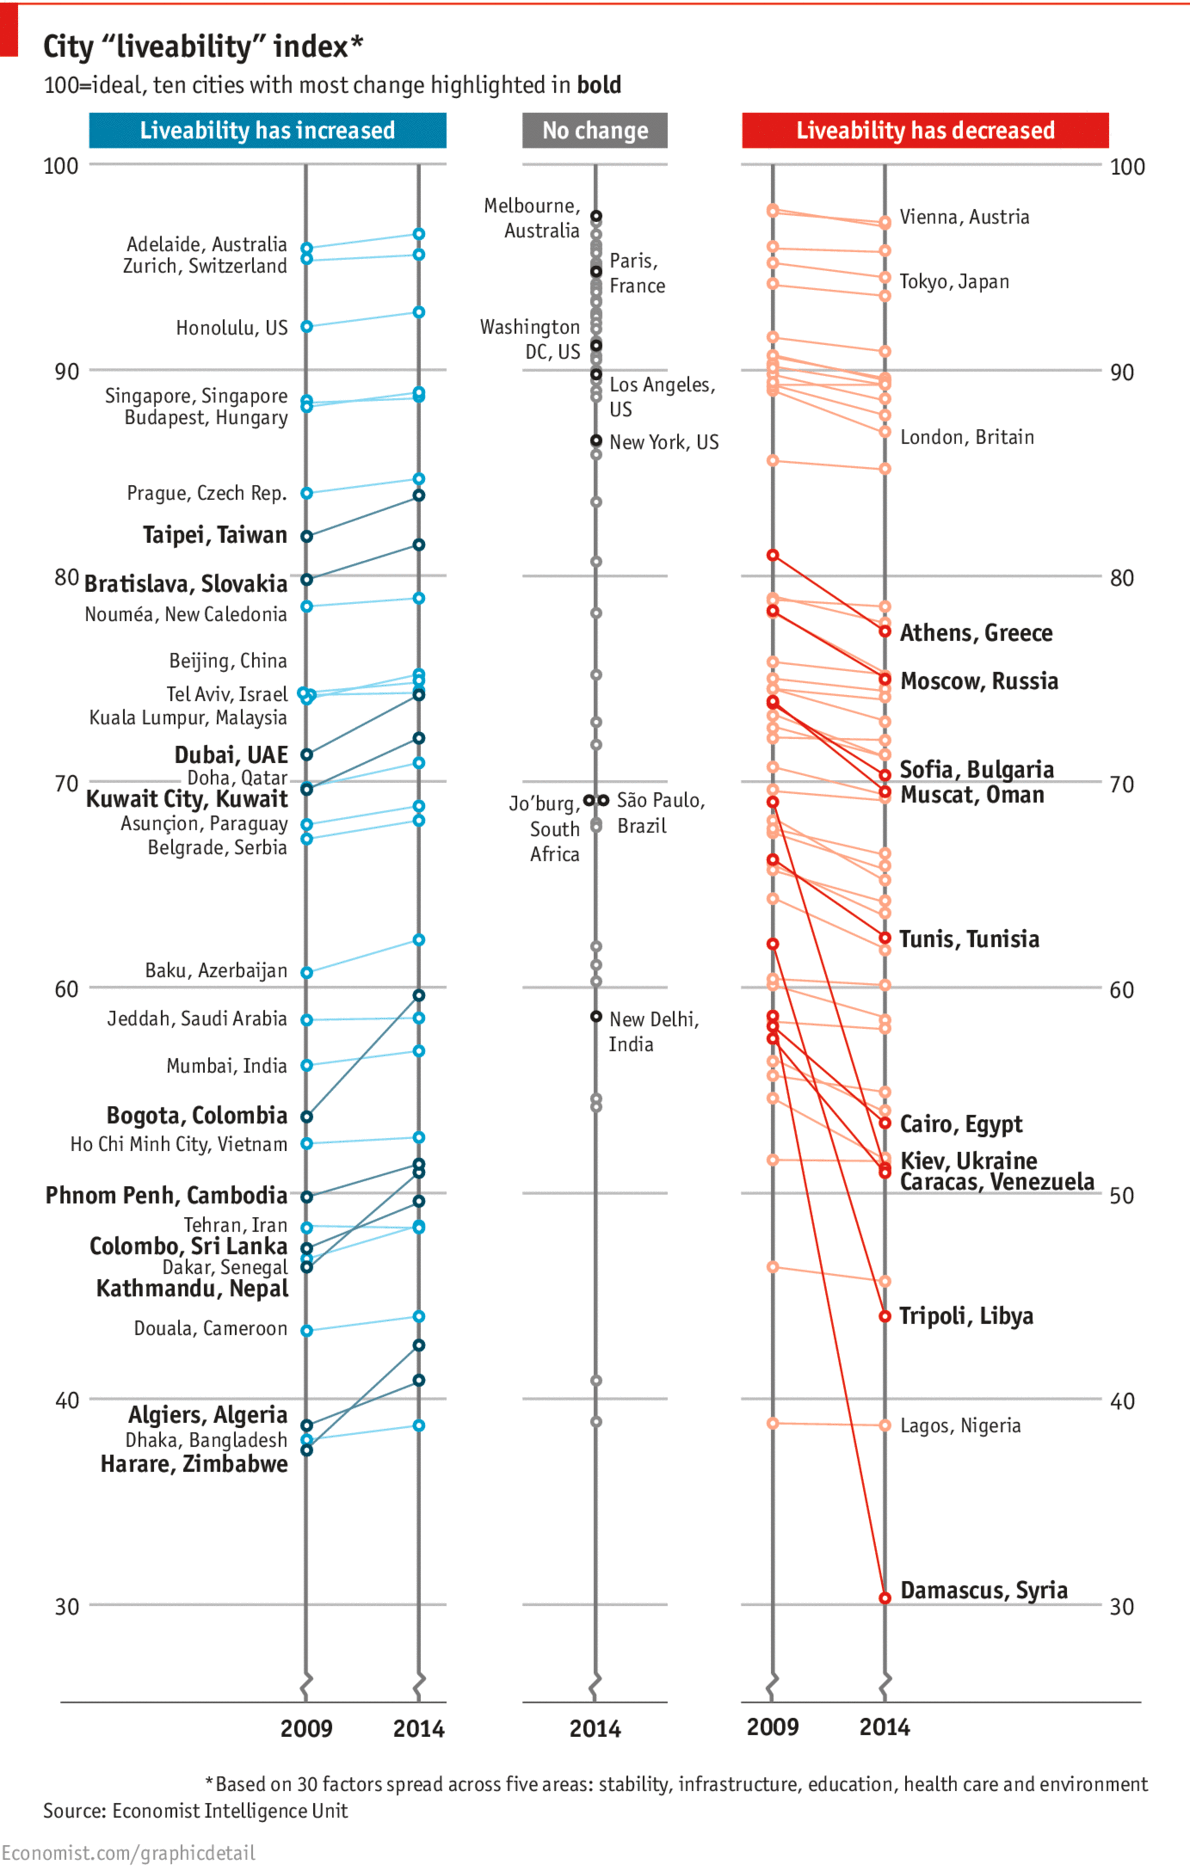
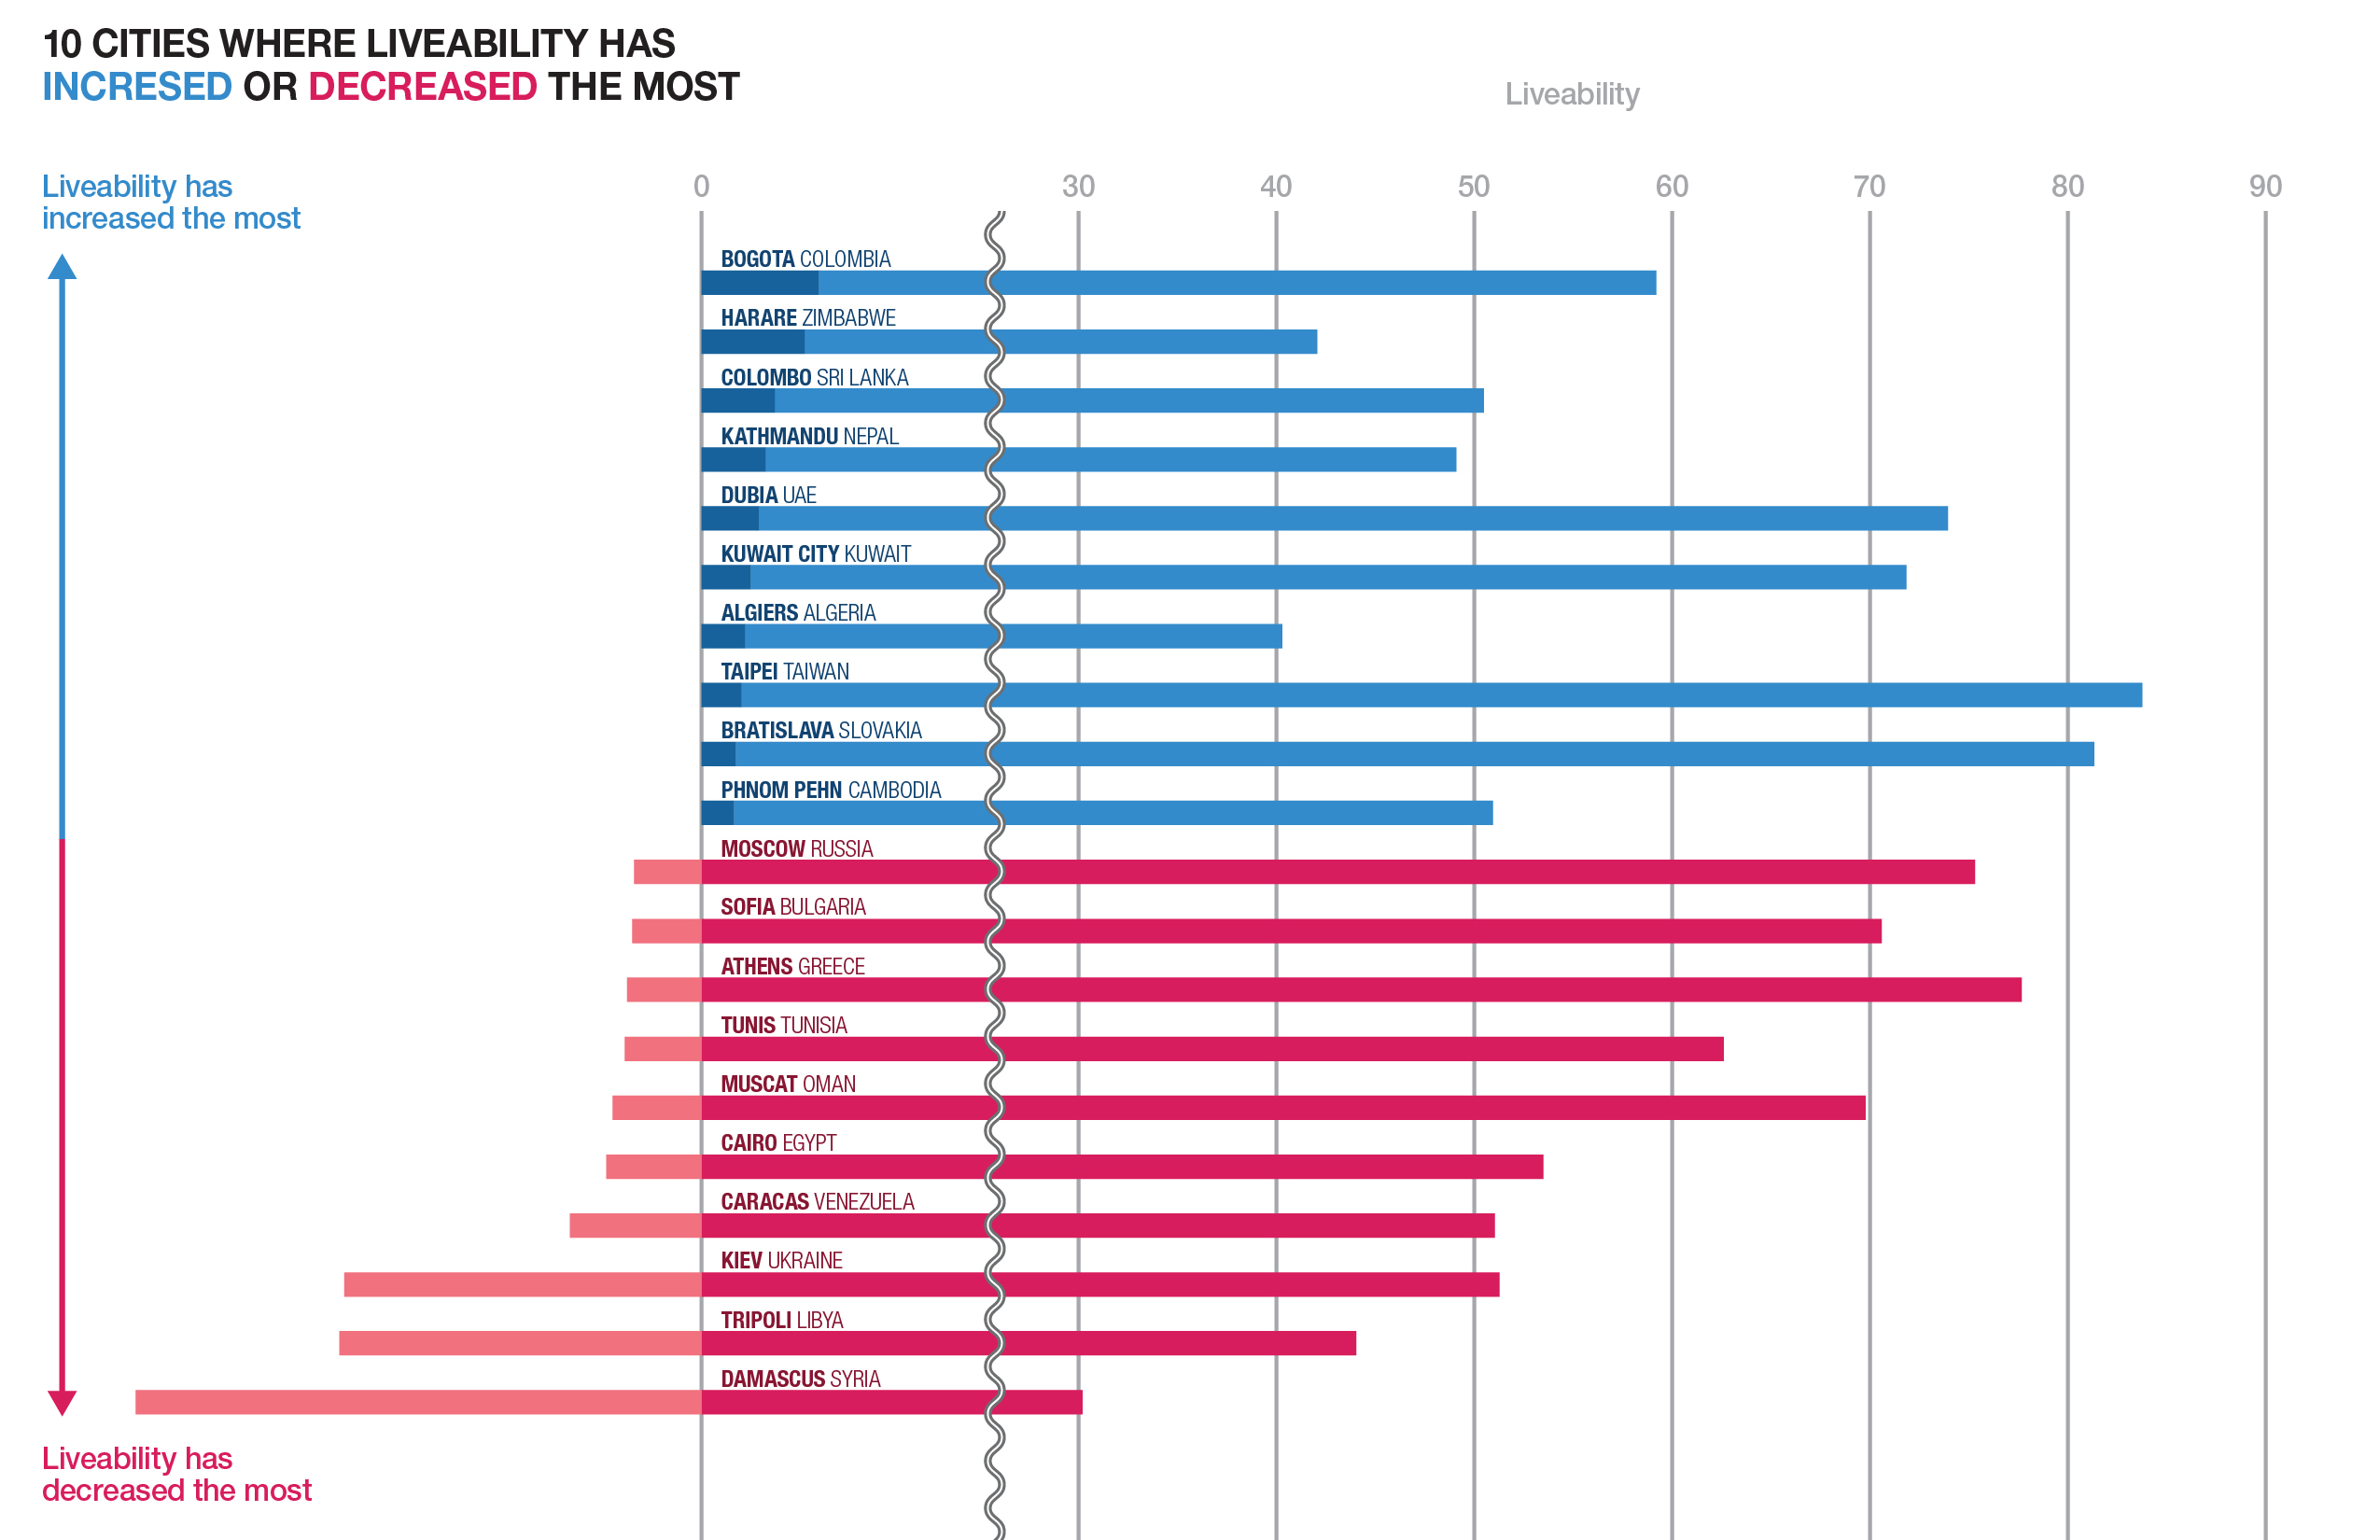
While I was browsing the web to find an infographic for the makeover assignment, I found an article on The Economist including this interesting infographic that compares the most liveable cities.

original infographic 1

The infographic separates cities into three different groups where liveablity has increased, not changed and decreased. Each cities are grouped quite clearly, yet I am confused about some ways in which the data is presented: firstly, why there are dots that do not have their name on each line, secondly, which standard determines if each dot has its name or not, and lastly, why there are even cities that have no change shown.

I think all the questions come from excessive omission of the infographic. The infographic coveys quite comprehensive data, but since it takes away the most important information, like the name of the city, it is questionable that the infographic is intended to selectively show just some cities that have the most change of liveability.

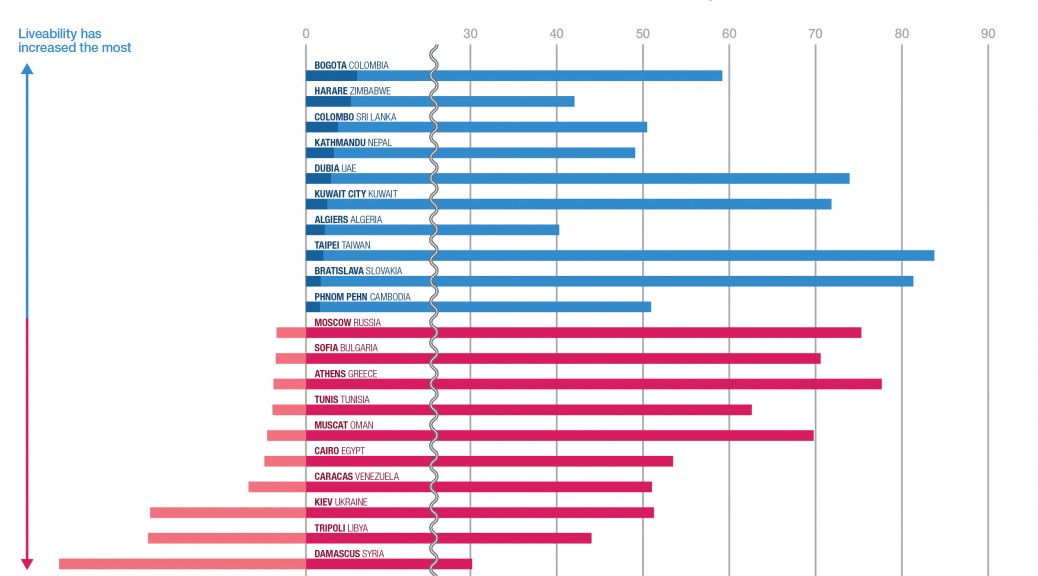
To make the infographic clearer, I’d rather simply take some more intriguing part out of it and focus on that: cities where the liveability has increased or decreased the most.

revised infographic-02

I re-sorted out cities depending on their increase or decrease so that it is easily recognizable that which city shows the biggest growth or decline. In addition, you could find out the fact that the bigger decline a city has compared to past, the lower liveability the city tends to score in the present.


Research Assignment

Data Visualization Aggregator 

The Kantar Information Is Beautiful Awards was organized by David McCandless, the author of Information is Beautiful, and announces the most excellent data visualizations and infographics of the year. You can see from interactive infographics to motion infographics that have been selectively presented on the website.


Data Visualization

The Bike Share Map (New York), which is managed by a british research, Oliver O’Brien, aggregates the data of Bike Share schemes in over 100 major cities all over the world. The vast data is clearly displayed in two different ways: a way in which you can see the real time data or a timeline that shows data changes of the past 48 hours.


Artist/Designer

Nicholas Felton, a Brooklyn-based infographic designer, is famous for annual reports regarding himself that visualize data of daily life. It is interesting that trivial information of one’s daily basis can show intriguing narratives when it is visualized .


Discussion Forum

Open Processing provides people with a space to share and collaborate Processing works with others.


Criticism

False Visualizations: Sizing Circles in Infographics was written by Randy Krum on his website. It discusses what was wrong about the infogrphic in the article “The Truth about the Ice Bucket Challenge,” by underlining that infographics require precision.


Data Source

Wunderground API is a good source if you are interested in producing infographic that deals with weather information.


Data Ethics

Data Will Help Us is a manifesto, created by a digital artist Jonathan Harris and commissioned by The New York Times.  This project questions the positive and negative impacts of “Big Data,” which is now invisibly invading your daily environment.


Book

The Book of Trees: Visualizing Branches of Knowledge is basically about trees, and it seems breaking away from data visualizations or infographics at first glance. However, Manuel Lima, a designer and the author of the book, gives many examples of tree shapes which have been universally used as a graphic form for infographics throughout the book.