Links

Code Warmup

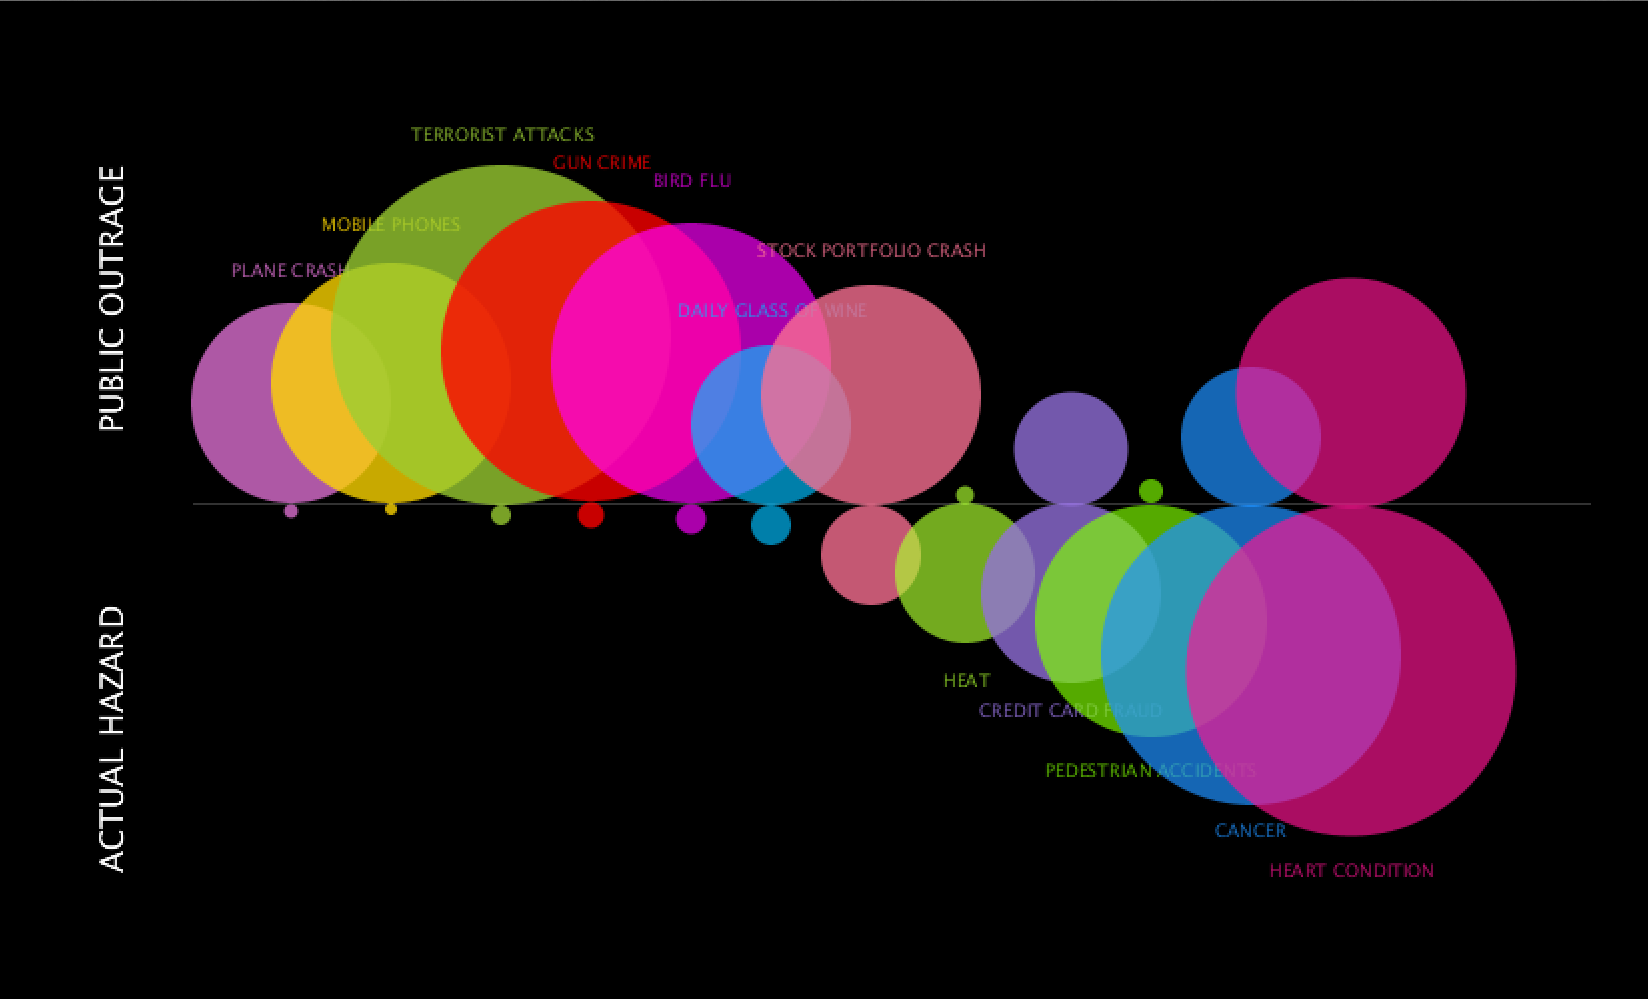
For my code warmup, I chose a pretty simple visualization that showed the comparison of public outrage against life risks versus the actual hazard of each risk. Here is the original image:
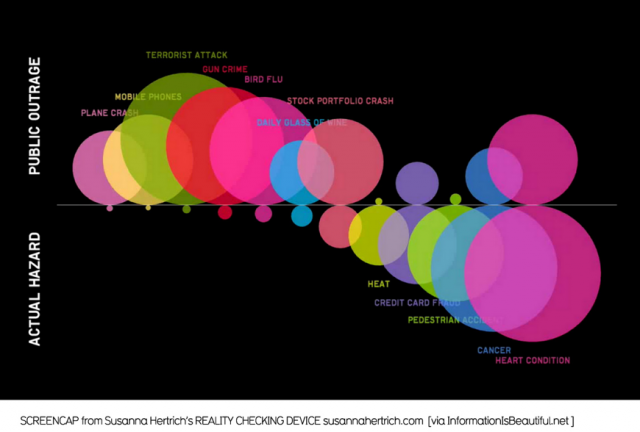
Picture-2-640x432

Here is the Processing copy:

Screen Shot 2014-09-22 at 3.11.15 PM


Surprisingly, most of the work was recall of past Processing experience.  It was tedious finding exact coordinates and I know there is a way to drag the screen for the coordinates but could not figure that out. Asides from that, the ellipses were just trial and error and eyeballing (and more math than usual in my daily life) to figure out size and placement.

It was a lot more interesting to figure out the next assignment. I decided to make over the same visualization because although it has interesting information, I was curious to see it organized differently. The original layout shows from smallest to biggest actual hazards and their public outrage counterparts. Taking a look at the information is interesting in itself but overall, it felt like both public outrage and actual hazard were competing for attention with the largest bubbles for either side focused on left and right. I wanted to flip it and see the results for smallest to biggest for public outrage. I did a quick sketch in Illustrator and realized that I, myself, read the information more clearly in this layout. Somehow there was cohesion by focusing primarily on the growth of outrage and realizing a bigger negative space for actual hazard. There is more contrast for one side that helps you focus on the other and then make the comparison. Lastly, I structured the titles for each bubble to be above and connected with a hanging line. It was a pain to figure out rotated text, but rationalizing comes a long way in code and sometimes things just came in place which made the process a lot more fun.  This is the redo:
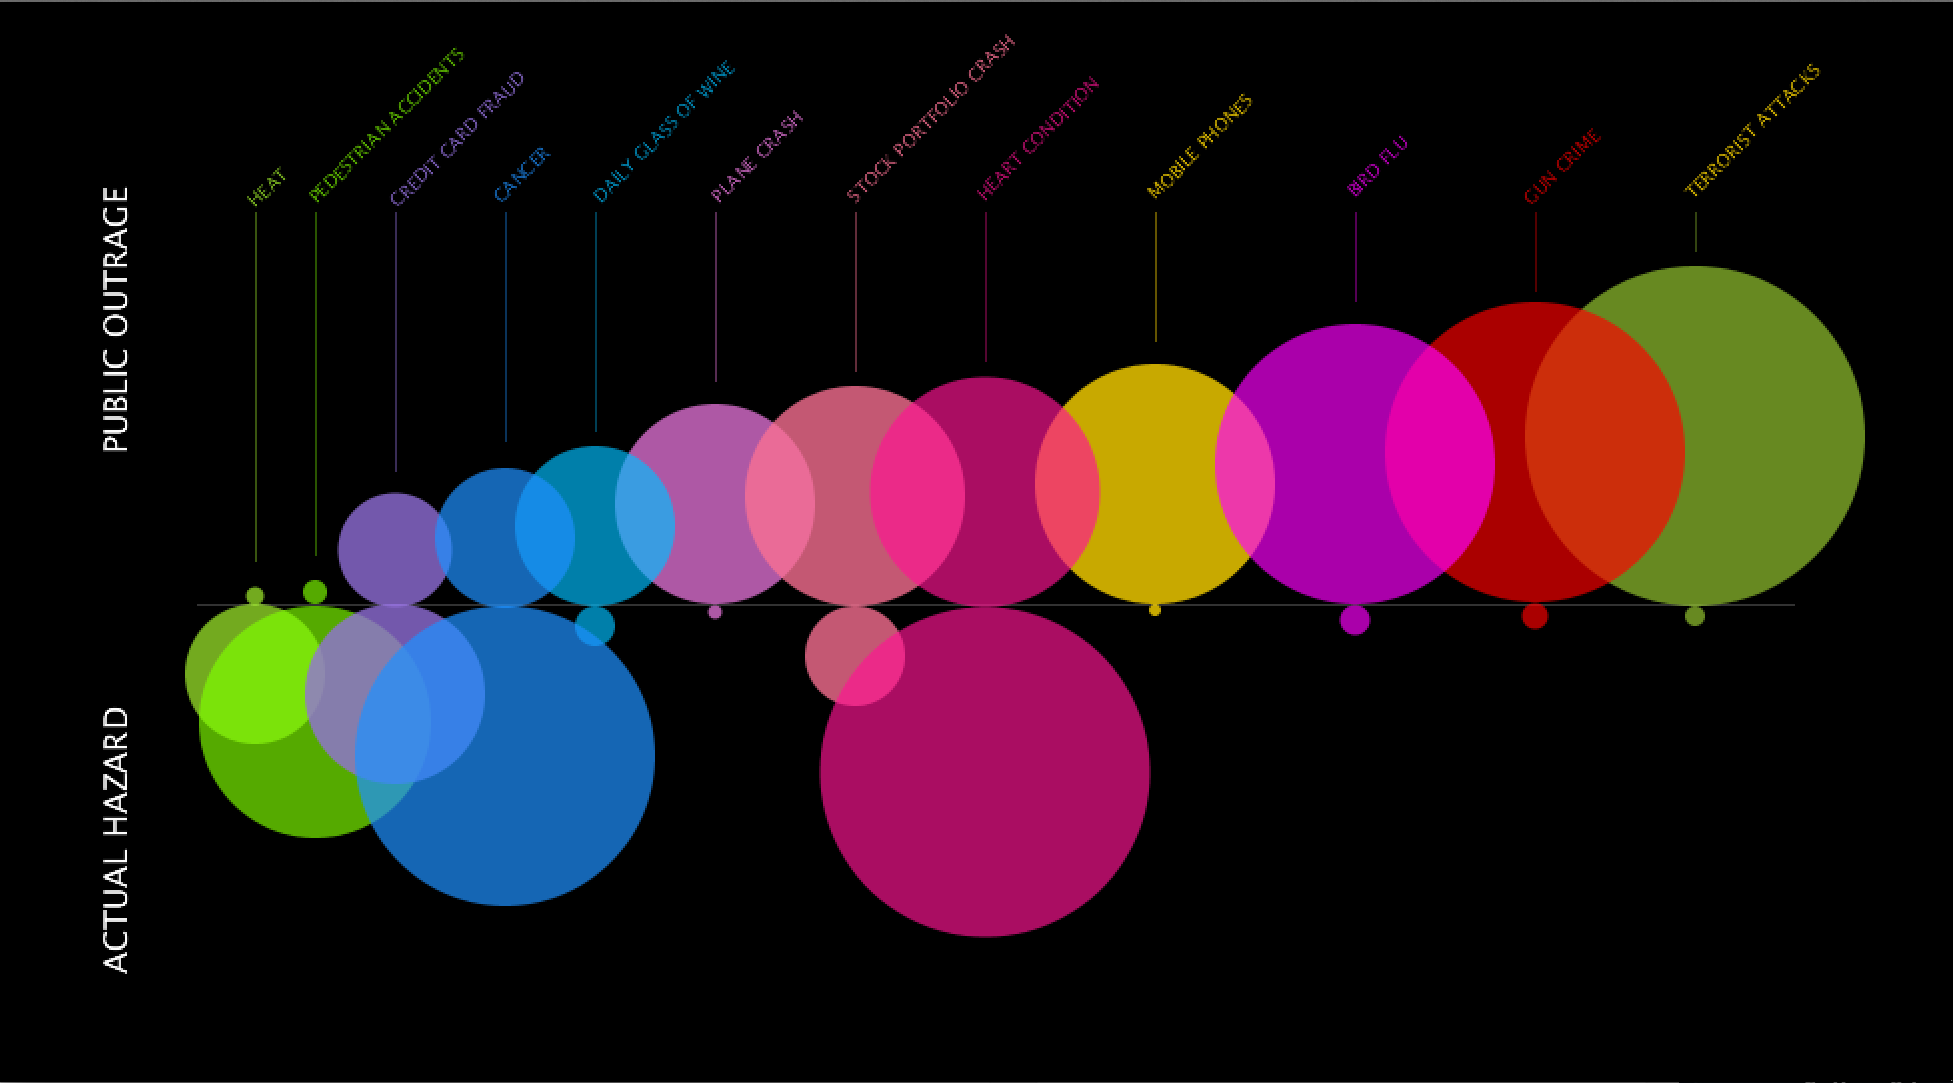
 

Screen Shot 2014-09-22 at 5.07.07 PM

Code

Research Assignment

Hi there.

After the most intense internet searching of my life, I found some pretty cool things to share with you all. Here they are:

Data Visual Aggregator: webdesignledger.com 
It’s one of those conglomerate websites that shows lists of interesting web related things, many of them info graphics. What was most appealing of the website was the pretty good tips in a few of the articles/lists and the topics that curated the visual data.

A Visualization: Josh Worth’s Pixel Universe 
This is by far the most time consuming search I did but it really puts into perspective the solar system like you’ve never seen it before. Definitely fun to read and very well considered in design.

Artist/Designer: Loren Munk
An oil paint artist/ you tuber/art critic that paints wildly intricate, text heavy paintings of NY city life, geography, and art scene. It combines the complexity of data and digital with the painterly and organic look of a fine arts piece. My favorite
 Tatiana Plakhova is also incredible! She creates works within what she calls ‘network  visualization‘.

Visualization Tool: Tableausoftware
Tableau uses a body of different databases and other software (VizQL, Live Query, and In-Memory Data) to create a cleaner understanding of data for companies.

Data Collection Tool: IBM SPSS Statistics Software 
An extreme version of Excel, SPSS Stats uses basic data management and documentation with the addition of several features that simplify the experience for the ease of the user.

Discussion Forum: Devshed.com
One of the cleaner forums in my search, devshed is organized by programming language forums, tools, and articles. It contains a lot of information but is navigable through a pull down menu and icons for almost everything.

Criticism: Slate Blog Criticizes Rape Infographic 
By Amanda Marcotte. A simple visualization of rapists tried, convicted, and falsely accused compared to the amount of actual rapists demonstrated how impactful visual data could be to those without the facts and those with. It fired up a conversation over not just accuracy issues but the incorrect message given out to internet users.

Data Source: Data.gov
This database is clean and simple. Organized by categories, one can dive into any large theme and find several documents with government- found, reliable information.

Data Ethics: A Code of Ethics for Data Visualization Professionals
This straightforward article discusses what is to be expected out of a data visualizer. Three important tips I received were do not assume and if necessary make it known, give credit to all sources being used, and create a hierarchical system that communicates the data clearly.

A Book:
TBA