All posts by Sarah Montero

Poster: Asthma Environmental Factors and Pollutants that contribute to the disease

Asthma Environmental Factors and Pollutants that contribute to the disease

The What & The Who:

      When thinking of this project I knew I wanted to research data on environmental air pollutants and their affects on Asthma patients. When reviewing the data provided by the CDC and the EPA  I couldn’t help but notice a common theme in the higher rates of asthmatics in urban communities.

The Why:

       This theme promoted me to research this topic further .  Through this data analyses I’d like to take the tables from both the CDC and the EPA to find the most common air pollutant factors that contribute to asthma and see why the disease has increases in the last ten years. These consequences have been seen in many recent weather related disaster where the people most affected by these incidents are the poor and people of color in urban communities particular the children. Opportunities in these areas are far and few but the right to breathe clean air is the right of every human life and these supposed “act” and “laws” should have tougher enforcement rules.

The How:

     By creating an info-graphic poster that will hopefully  impact the viewer to the data provided along with a powerful graphic image that will help to disturb it’s audience.  I will  start  analyzing  the process  by following  a  basic formula which hopefully will bring me some more insight on the data. I ‘ll cross referencing  Asthma by  States (10 worst states for asthma) then by age group (ages  0-10) and by the types of air pollutants that are contributing factors to the disease.

Informations Sources:

The following is a list of pollutants being monitored by the EPA and which they have provided CSV data files.

CO2 emissions
Lead
Ozone
NO2
PM10
PM2.5 (particle matter)
SO2
PM2.5 Chemical Speciation Network
“Trends Speciation” and “Supplemental Speciation” monitors only
NATTA (National Air Toxic Trend Station)
NCore (Multi-pollutant Monitoring Network)

This is an interactive Map on Air data provided by the EPA and Google which provides CSV data on2014_EPA_AIR_QULITY
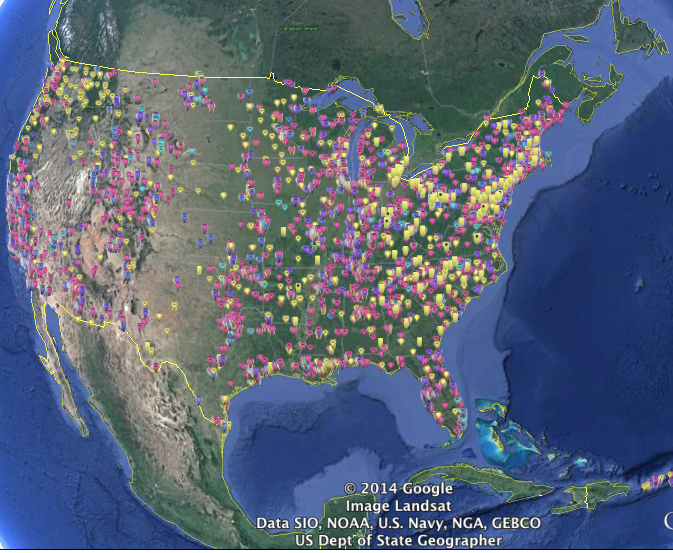
This is a closeup of the North East air quality.
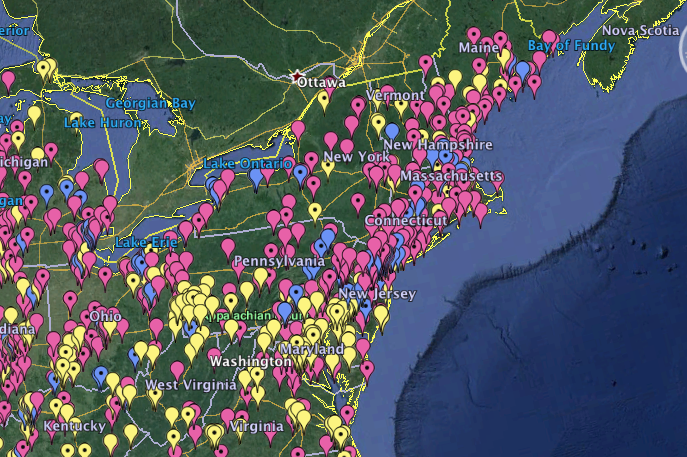
EAST COAST

EPA INTERACTIVE MAP

The pink is representational of the Ozone
The blue is representational of Carbon
The yellow id representational of  Lead


Asthma and Allergy Foundation of America 

Asthma capital

CDC

Screen Shot 2014-10-05 at 11.21.07 PM


Warm up in processing PART II

info-graphics-full-view

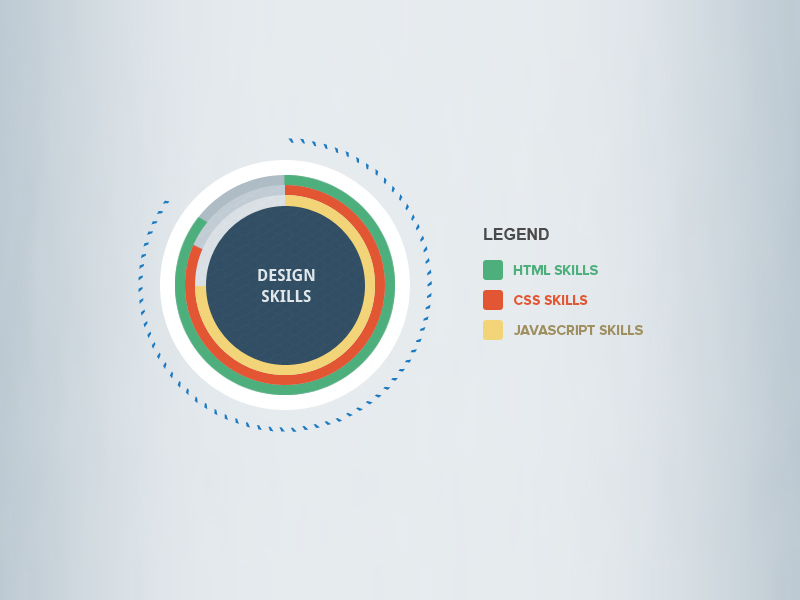
Above is an info. graphic that displace web application design skills.
I found this design on a designer’s portfolio web-site call Theme Designer. I chose to recreate this particular info. graphic because I thought it would work best with my level of coding skills.
http://themedesigner.in/simple-infographics-psd/

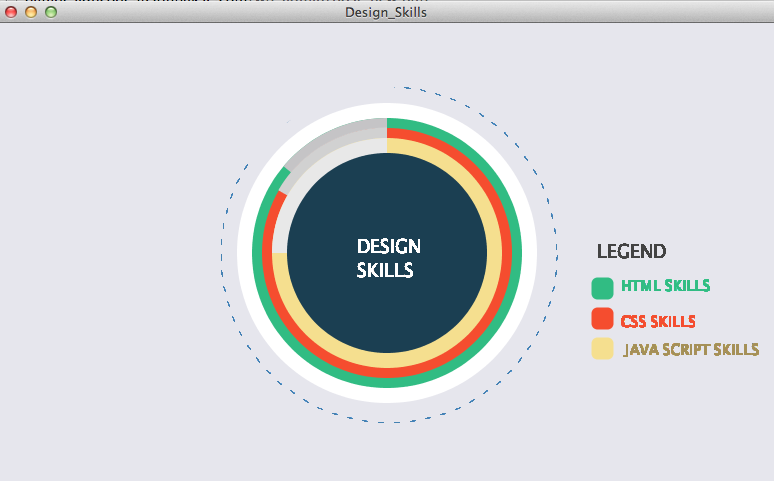
Image of my processing sketch

Screen Shot 2014-09-22 at 7.02.48 PM

Processing Code

PFont font; 
String quote = "DESIGN SKILLS";
String phrase = "LEGEND";
String ht = "HTML SKILLS";
String csheets = "CSS SKILLS";
String js =" JAVA SCRIPT SKILLS";
float radius = 100;
void setup(){
size (780, 460); 
background (#E6E6ED); //gray
smooth() ;
noStroke();
fill (255); // white 
ellipse (390, 230, 300, 300);
fill (49, 188, 131); // Green HTML Skill
ellipse (390, 230, 270, 270);
noStroke();
fill(#C5C4C6);
arc(390, 230, 270, 270, radians(220), radians(270));
fill (245, 77, 47); //Orange Css Skills
ellipse( 390, 230, 250, 250);
noStroke();
fill(#D1D1D1);
arc(390, 230, 251, 251, radians(210), radians(270));
fill (245,223, 143); // Yellowish Javascript Skills
ellipse (390, 230, 230, 230);
fill(#E8E8E8);
arc(390, 230, 230, 230, radians(180), radians(270));
fill (27, 63, 82); //Dark Blue center 
ellipse (390, 230, 200, 200);
strokeWeight(12); //green box html skills
stroke(49, 188, 131);
fill (49, 188, 131);
strokeJoin(ROUND);
rect(600, 260, 10, 10);
strokeWeight(12); // orange box CSS skills
stroke(245, 77, 47);
fill (245, 77, 47);
strokeJoin(ROUND);
rect(600, 290, 10, 10);
strokeWeight(12); // yellowish box JS skills
stroke(245,223, 143);
fill (245,223, 143);
strokeJoin(ROUND);
rect(600, 320, 10, 10);
smooth();
noStroke();
font = loadFont("AppleBraille-18.vlw");
textFont(font);
}
void draw(){
fill(#FFFFFF);
noStroke();
smooth();
text (quote, 360, 215, 125, 125);
fill(#434343);
noStroke();
smooth();
text (phrase, 600, 220, 150, 150);
scale(.8);
fill(49, 188, 131); //green
noStroke();
smooth();
text (ht, 780, 320, 150, 150);
fill(245, 77, 47); //Orange
smooth();
text (csheets, 780, 365, 150, 150);
fill(#A59057); //Yellowish changed for legabilaty
smooth();
text (js, 780, 400, 200, 200);
 stroke(#4481B2);
 strokeWeight(.5);
 noFill();
 translate(490, 290);
 dashedCircle(210, 2, 1);
 
 smooth();
 stroke(#E6E6ED); 
 strokeWeight(12);
arc(-0, -80, 365, 260, radians(200), radians(270));
}
 
void dashedCircle(float radius, int dashWidth, int dashSpacing) {
 int steps = 200;
 int dashPeriod = dashWidth + dashSpacing;
 boolean lastDashed = false;
 for(int i = 0; i < steps; i++) {
 boolean curDashed = (i % dashPeriod) < dashWidth;
 if(curDashed && !lastDashed) {
 beginShape();
 }
 if(!curDashed && lastDashed) {
 endShape();
 }
 if(curDashed) {
 float theta = map(i, 0, steps, 0, TWO_PI);
 vertex(cos(theta) * radius, sin(theta) * radius);
 }
 lastDashed = curDashed;
 }
 if(lastDashed) {
 endShape();
 }
}

Here is my version of this info. graphic.
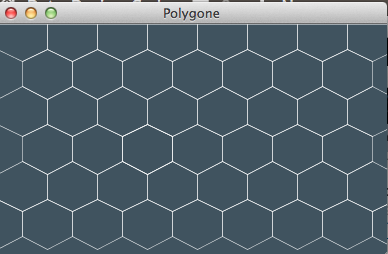
Note on issues :  First issue I had with this design was the polygon pattern in the center of the original design. I was able to create the pattern however sizing it over the blue ellipse was something I just could accomplish. I did, however include an image of the design and it code for your reference.

Polygon Texture Image


Screen Shot 2014-09-22 at 7.04.48 PM

Polygon Texture Code

size (390, 230);
smooth();
background(#40535F);
strokeWeight(1);
stroke (255); //Shape1 row 0
noFill();
scale(.5);
beginShape();
vertex(50, 75); 
vertex(0, 50); 
vertex(0, 0); 
vertex(50, 0); 
vertex(100, 0);
vertex(100, 50);
endShape(CLOSE);
Repeated above code into 5 rows of 9 shapes 

The second issue I had with this graphic was the gradient background. I was able to recreate it but unable to included in the code of the whole design.

Gradient Color Code

Screen Shot 2014-09-22 at 7.17.53 PM

// Constants
int Y_AXIS = 1;
int X_AXIS = 2;
color b1, b2, c1, c2;
void setup() {
 size(640, 360);
// Define colors
 b1 = color(#AFD6F5); //light blue
 b2 = color(255); //white
 noLoop();
}
void draw() {
 // Background
 setGradient(0, 0, width/2, height, b1, b2, X_AXIS);
 setGradient(width/2, 0, width/2, height, b2, b1, X_AXIS);
 // Foreground 
 
}
void setGradient(int x, int y, float w, float h, color c1, color c2, int axis ) {
noFill();
if (axis == Y_AXIS) { // Top to bottom gradient
 for (int i = y; i <= y+h; i++) {
 float inter = map(i, y, y+h, 0, 1);
 color c = lerpColor(c1, c2, inter);
 stroke(c);
 line(x, i, x+w, i);
 }
 } 
 else if (axis == X_AXIS) { // Left to right gradient
 for (int i = x; i <= x+w; i++) {
 float inter = map(i, x, x+w, 0, 1);
 color c = lerpColor(c1, c2, inter);
 stroke(c);
 line(i, y, i, y+h);
 }
 }
}


Makeover Assignment

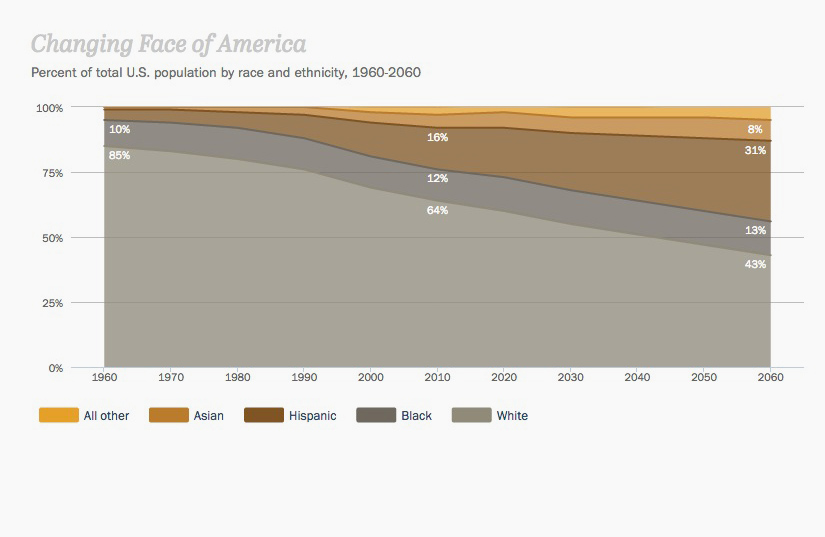
I decided to “Makeover ” this infographic which was originally done by Pew Research Center and then redone by NBC Nightly News but instead of improving the chart they made it worse.
Source  

Earlier this week, the NBC Nightly News decided to recreate an infographic originally published by the Pew Research Center, showing the distribution of race and ethnicity in the U.S. from 1960 to 2060. The result is so hilariously thick-headed, it might have already won the title of worst info-graphic of 2014.


Changing Face of America
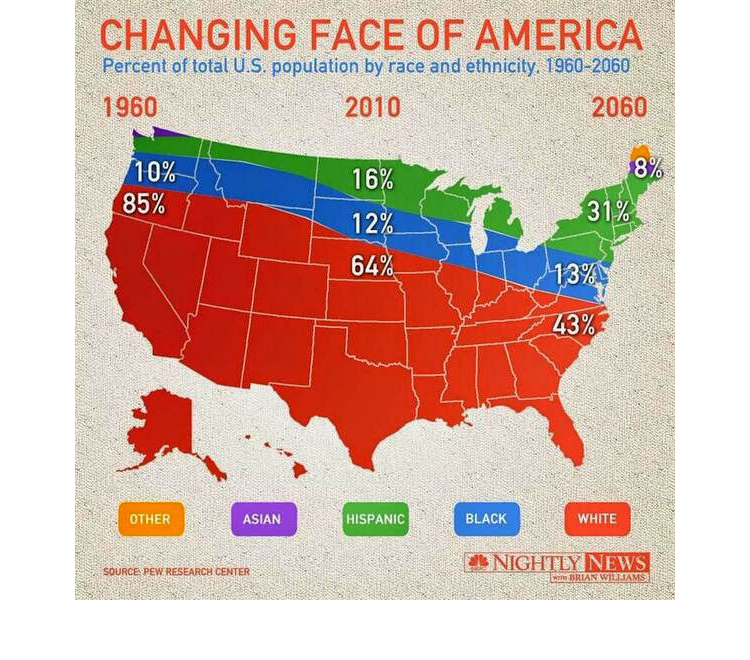
But when NBC Nightly News came along, they decided to punch up the “Changing Face Of America” visualization by abandoning the rectangle and charting the graph to a map of the United States instead. And in doing so, they completely changed the data’s meaning, instead visualizing… what, exactly?

Revised NBC Info. Graphics

According to the NBC Nightly News infographic, all Asians live in either Northern Maine or upstate Washington, while South Dakota is an excellent place to be black, along with much of Montana. There is not a single Hispanic within a thousand miles of the Mexican border. And more over, there are hard geographic borders set up to prevent races from drifting into each other’s territories.

Meanwhile, talk about jet lag. The time zone difference between the West Coast and the East Coast is 100 years! And, in fact, thanks to some sort of apocalyptic disruption of space-time, the vast majority of Americans either live in the future or the past.


ChangingFacesChart

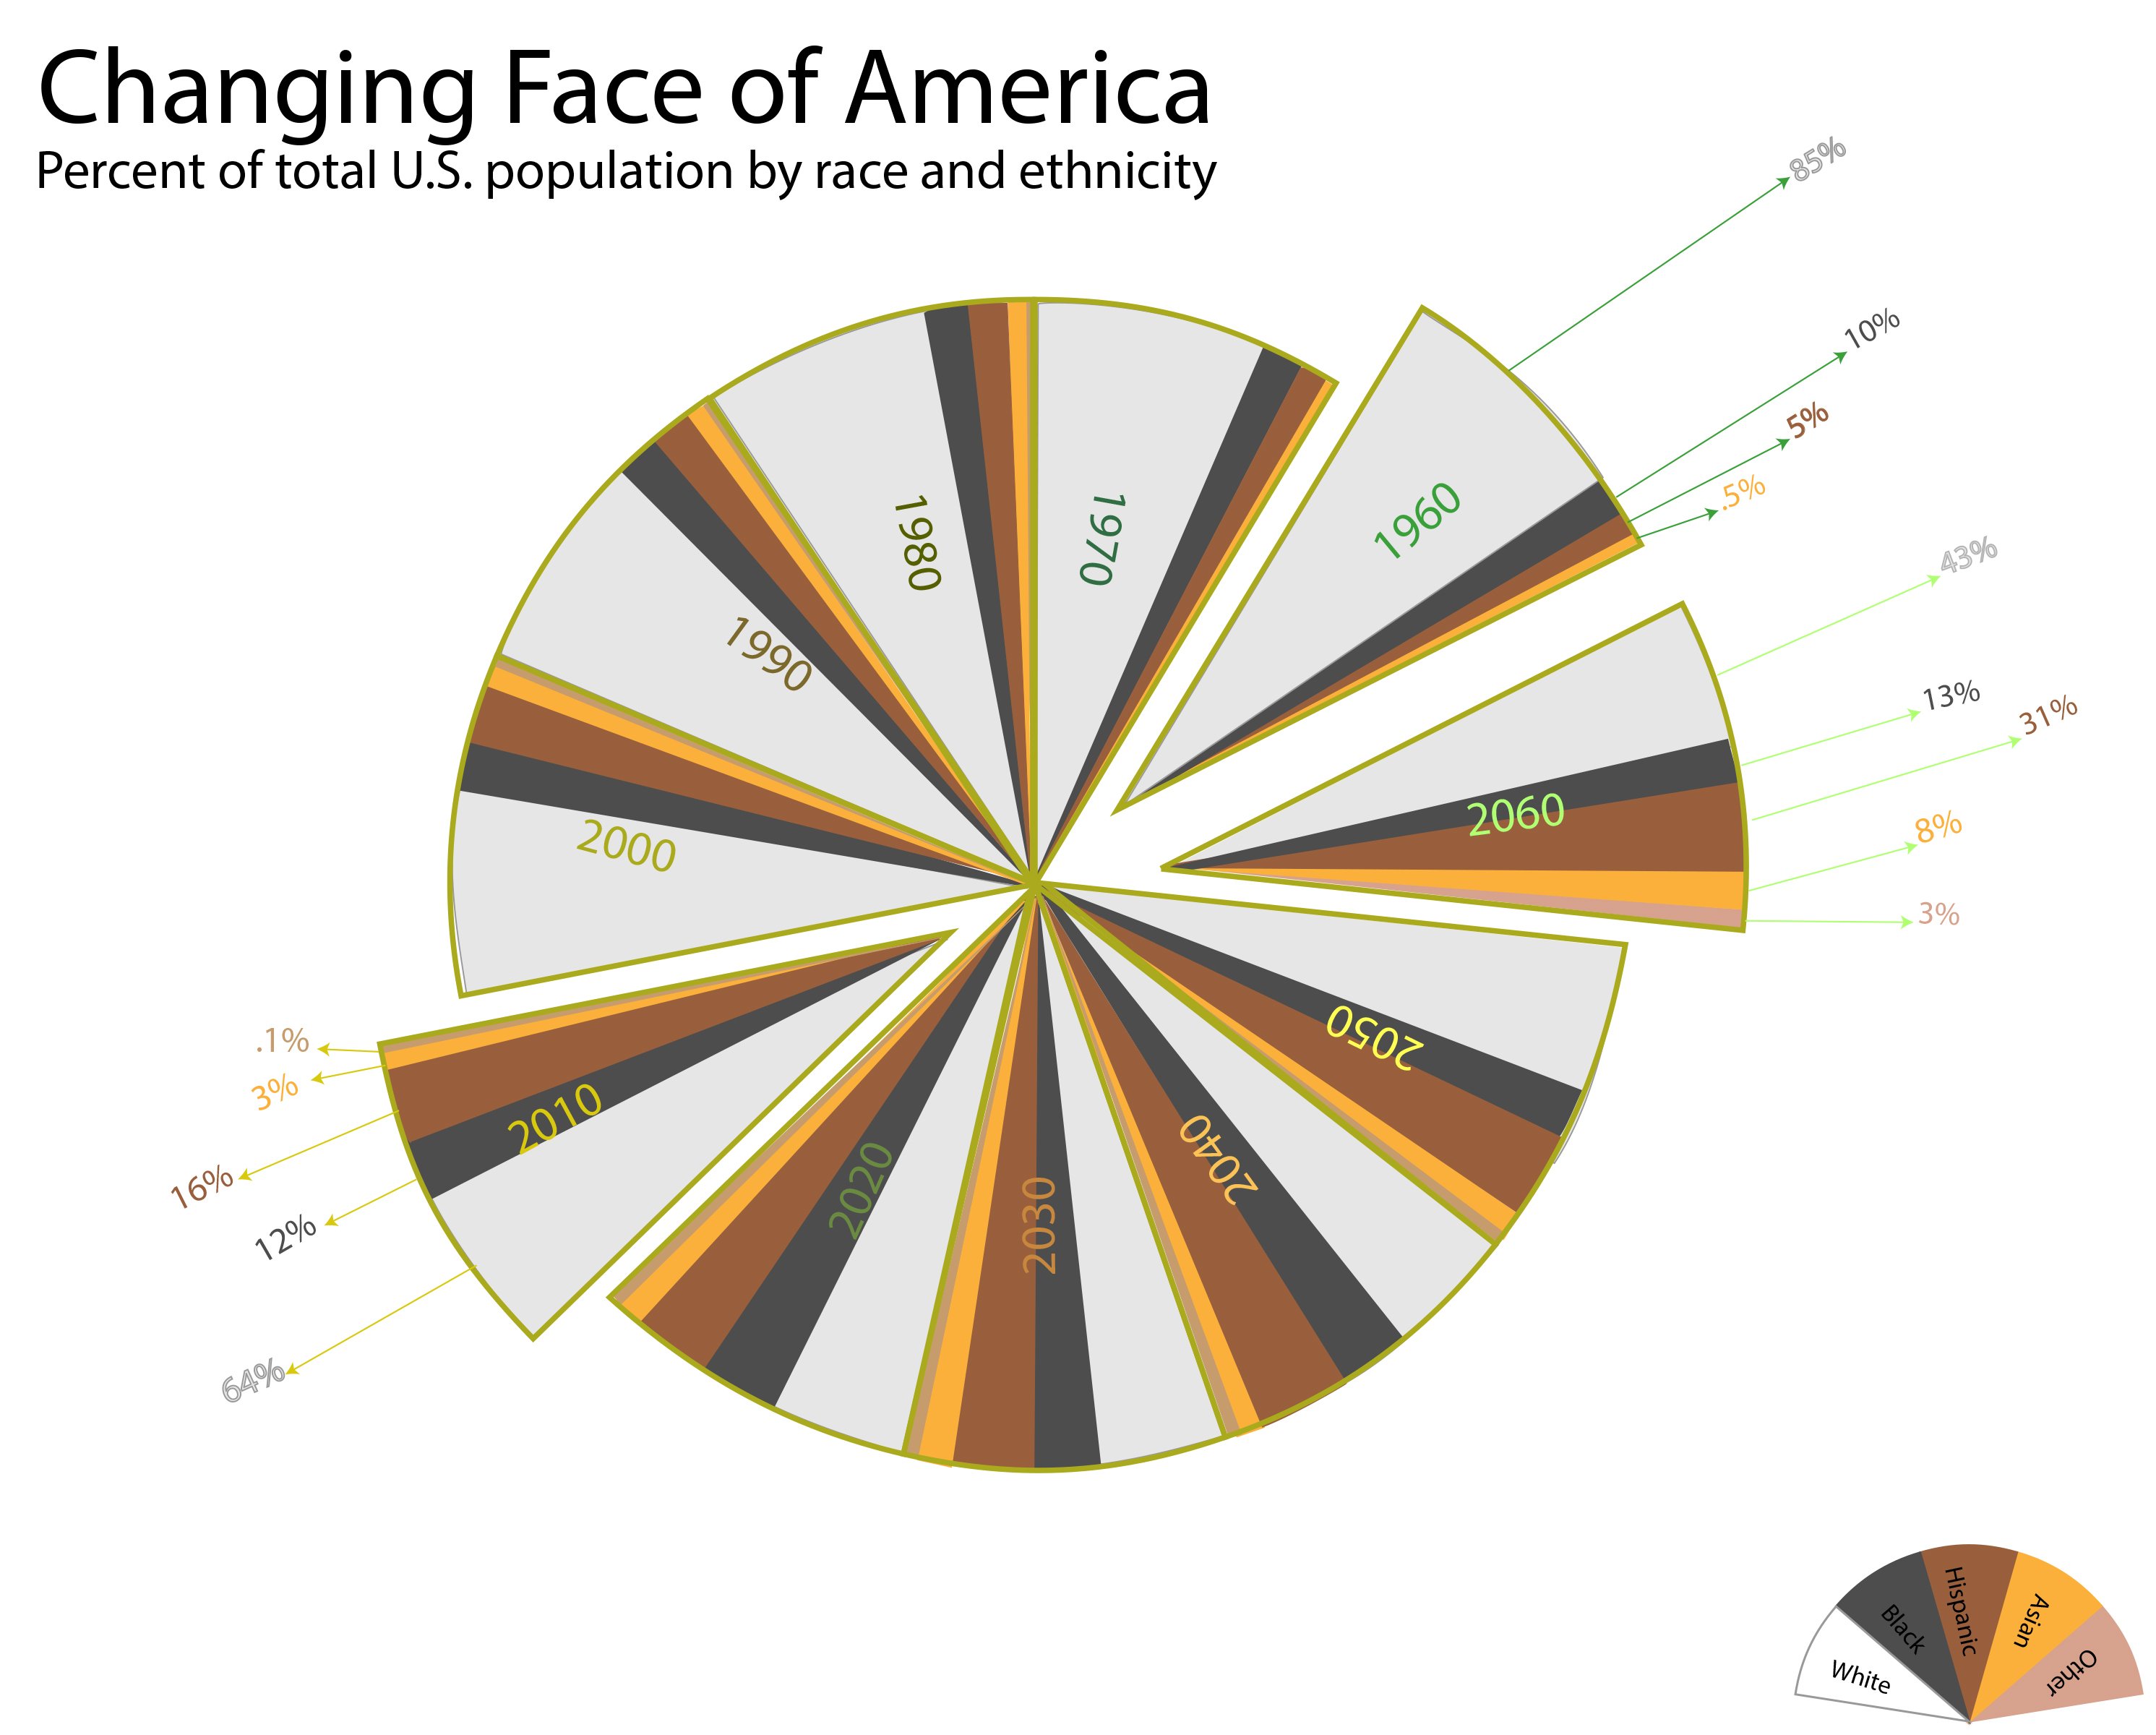
I choice a pie chart for my version of this info-graphic
I split the pie into 11 sections for each decade then color coded each
of the decades. Within each slice are the five different ethnic value
per color of ethnicity and is shaded in per the % provided by the initial chart. Because there were only three sets of percentage  values
given in the 1960, 2010 and 2060 I pulled those slices out to show the data. The arrows pointing to each of the percentages is the color code assigned to each decade for clarity.


Survey Assignment

Class Personality Treats
based on the four elements

According to the data collected

  • 50% of the class are Air signs
    Air sign personality treats are : are Detached, curious, social, distant, unemotional, flighty, aloof
  • 40% of the class are Water signs
     Water sign personality treat are: Emotional, private, moody, psychic, spiritual, feeling, compassionate
  • 1% of the class is Earth Sign
    Earth sign personality treat are: Earthy, grounded, practical, cautious, reliable, conservative, realistic
  • 9% of the class is N/A ( Not Applicable)Class Personality

Research Assignment

Artist/Designer

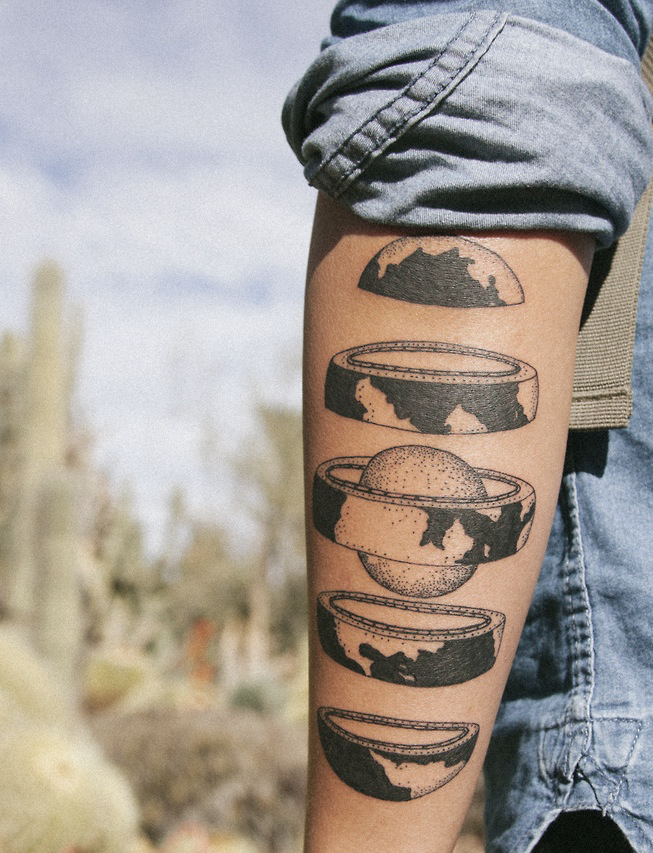
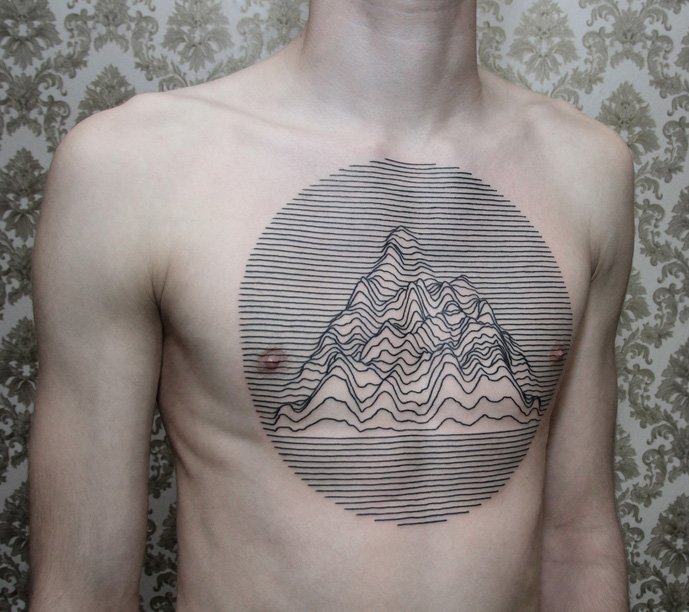
I thought this was an interesting site in the view point of artist and designer, although these designs are  not meant as data, I felt it was a great representation of data on an uncommon medium.

contemporary-tattoos-45 contemporary-tattoos-2 contemporary-tattoos-21

Info. Graphics on the body


Info. Graphics
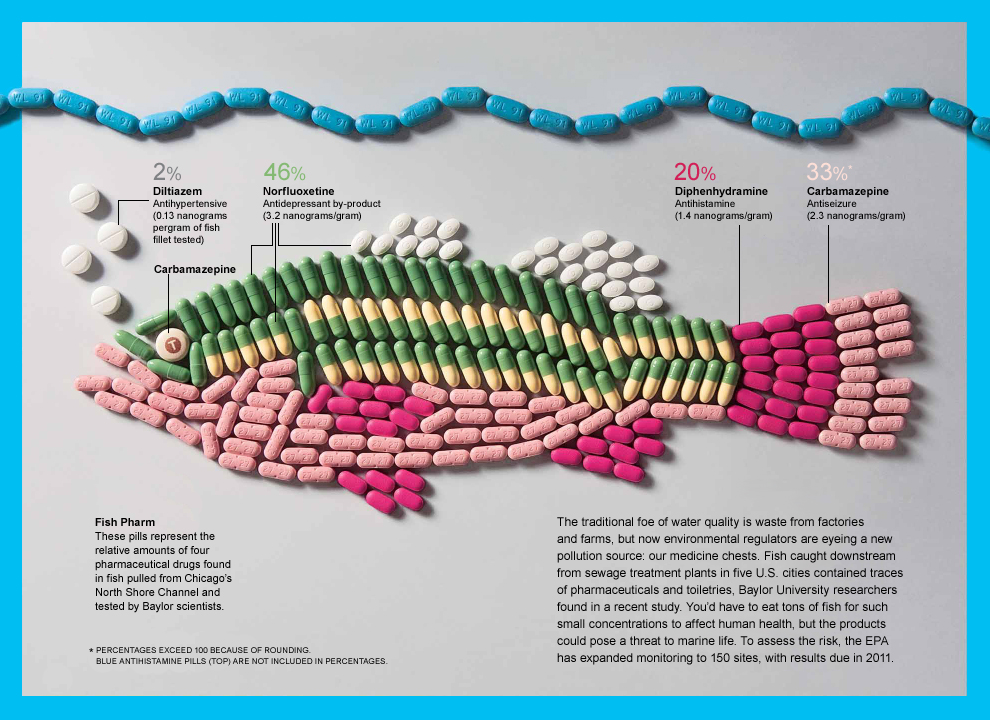
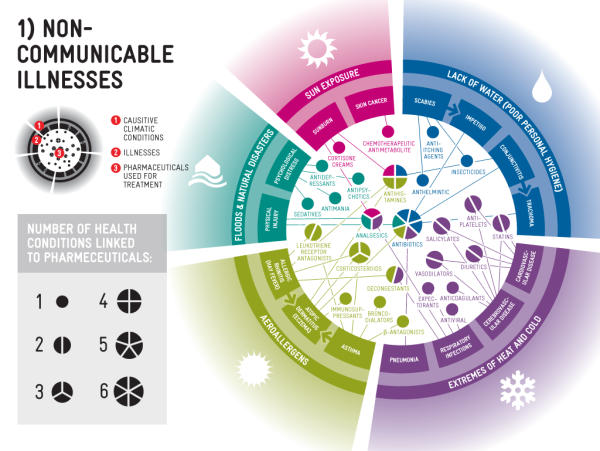
I use to work for a Pharmaceutical advertising company
and I thought it would be a good to highlight some of
Info. graphics used in that industry. Some of the marketing
materials these companies use are unbelievable, I once read this on
a new campaign this was what was said in a nut shell
COPD is a new disease in the market and has great market potential 
for the Pharmaceutical Industry.

Pharma Graphics  
Fish-Pharm-infographic


planning

Science and Technology 

ccandpharma_v35

A Visualization
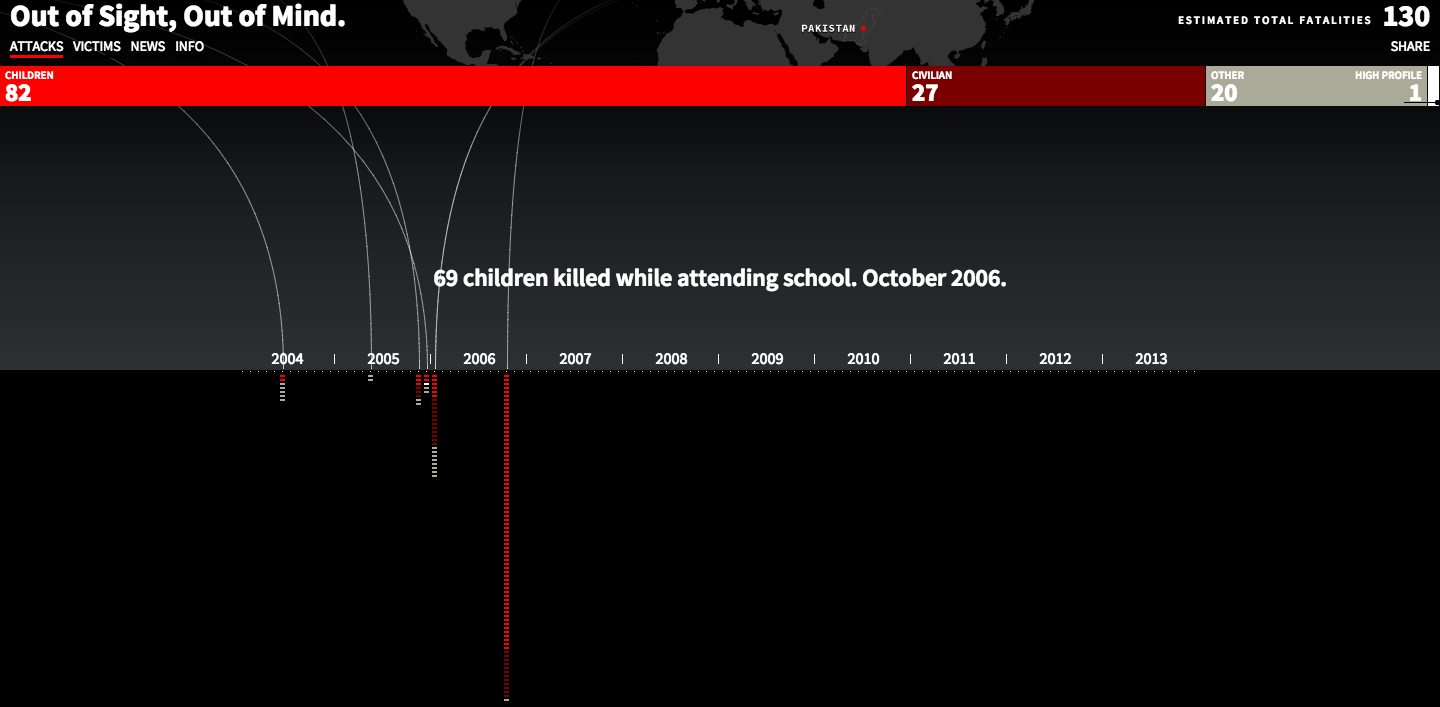
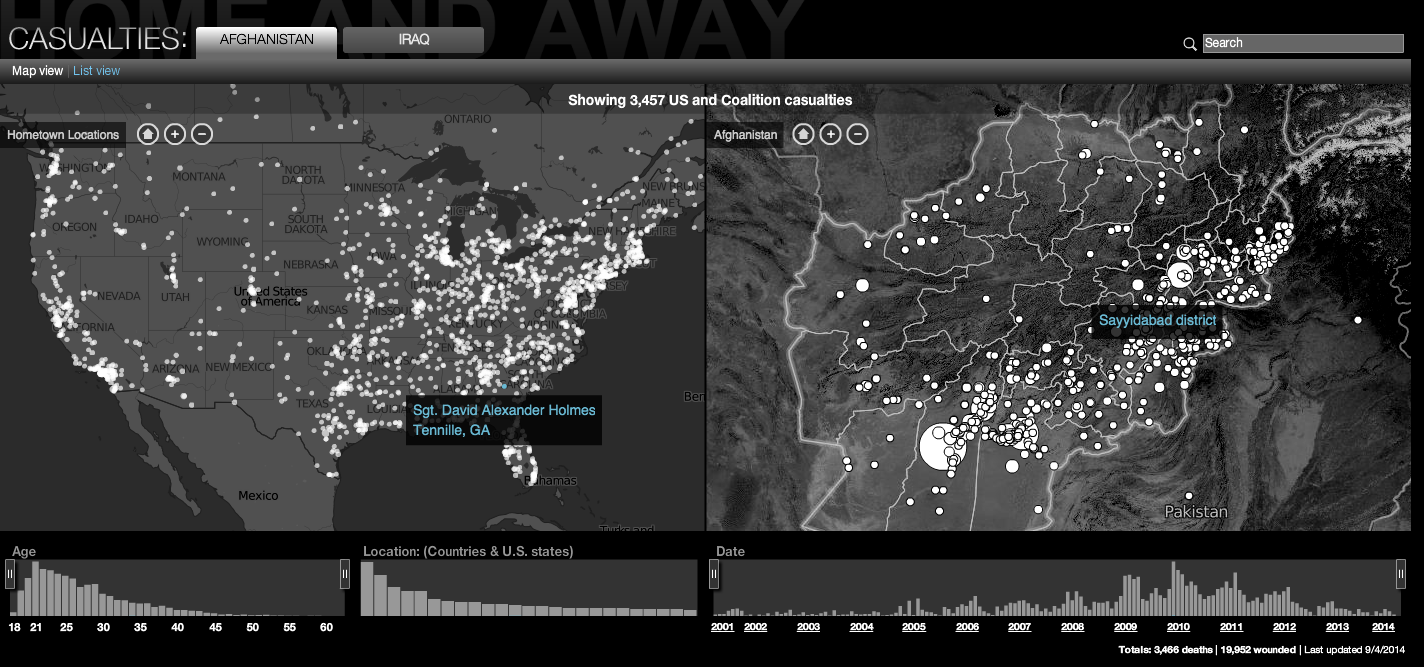
Both these links display interactive data visualization
showing the perspective of two side of the war in the
middle east. The first one shows how the war is being fought with
drones and the rise in casualties. The second link display the casualties of the solders fighting this war from different countries
and the two was in Afghanistan and Iraq.

Out  of sight out of mind

Screen Shot 2014-09-04 at 5.44.49 PM
CNN Data Visualization 

Screen Shot 2014-09-04 at 5.44.36 PM

Visualization Tool

Screen Shot 2014-09-04 at 6.58.44 PM
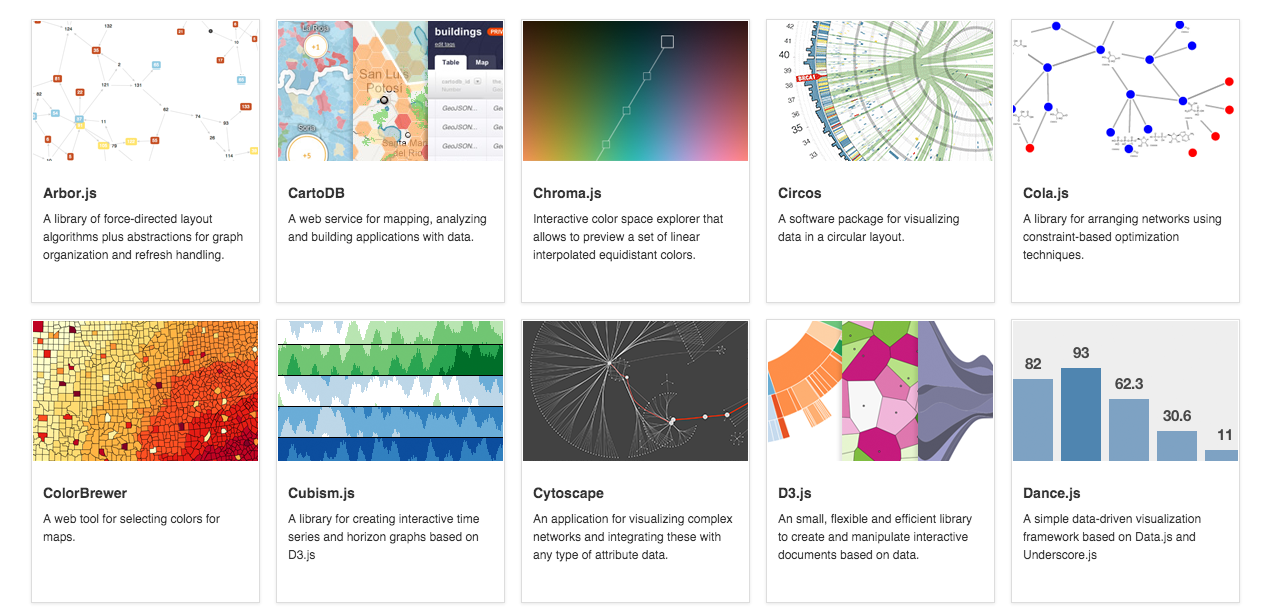
Below are four different links to Data Visualization Tool.
The first is to datavisualization.ch which shows examples of
different data visuals languages; Javascript, Processing, Flash
Java and others. What I liked the most about this first site is all
the great examples and links to those web-sites which provide
code and additional examples.  The other three links provide additional info. on code ,  examples and other processes such as storyboarding.

  1. Tools on Data Visualization
  2. Data Visualization Tool
  3. Data Driven Documents
  4. The Miso Project

Data Collection Tool
I was really sure where to look for these but
or what words to use besides the Data Collection Tool
to search in the browsers but below I think these two might
help in collecting data.

  1. Processing.JS
  2. Quadrigram

Discussion Forum
A point of view is a blog that deals with Data in the different points
One  in Visualization, Design Process, Elements of Visual styles and
the story telling of data.  There were many other blogs out there but
I felt this blog discussed a lot of components of Data, Graphics, Process and visuals to name a few. 
A point of view

Criticism
The MIT  blog Tech Review is making a Criticism the big changes happening in Software Development and open source code or as they put it “social coding web-sites” such site as GitHub and BitBucket have impacted this change.

MIT Tech Review

Data Source
I thought these sites were cool for data source and visual ideas.
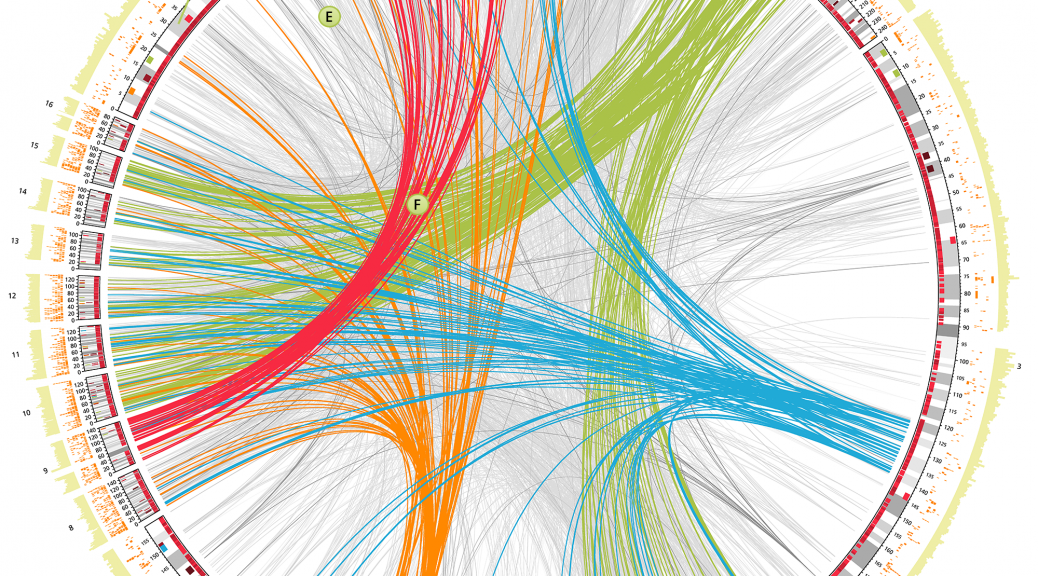
http://circos.ca/
A good source of large, formatted data suitable for visualization.
ScienceFun (Super Cool)

Data Ethics
MIT Big Data Review how much of ourselves are we giving away
and when is enough personal information enough?

MIT : What Big Data Needs, a code of ethics

A Book
Big Data – The Future of Education
By: Viktor Mayer-Schönberger and Kenneth Cukier
(You can download a free copy of this book)

Bad Data Hand Book
Mapping the World of Data Problems
By Publisher: O’Reilly Media

Data Classification Algorithms and Applications
By Charu C. Aggarwal

Other  Useful Links 

Useful Tool

Six useful JavaScript Library