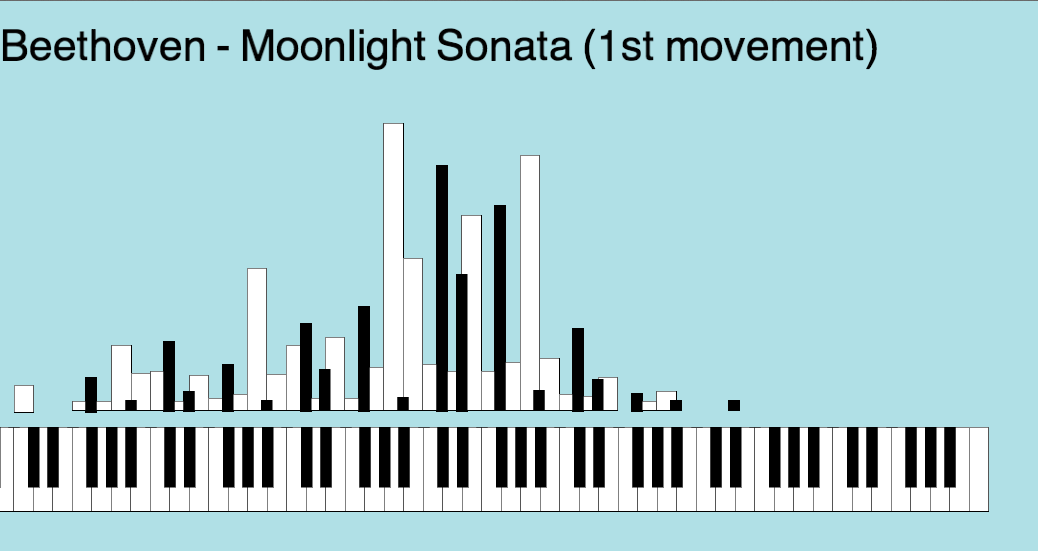
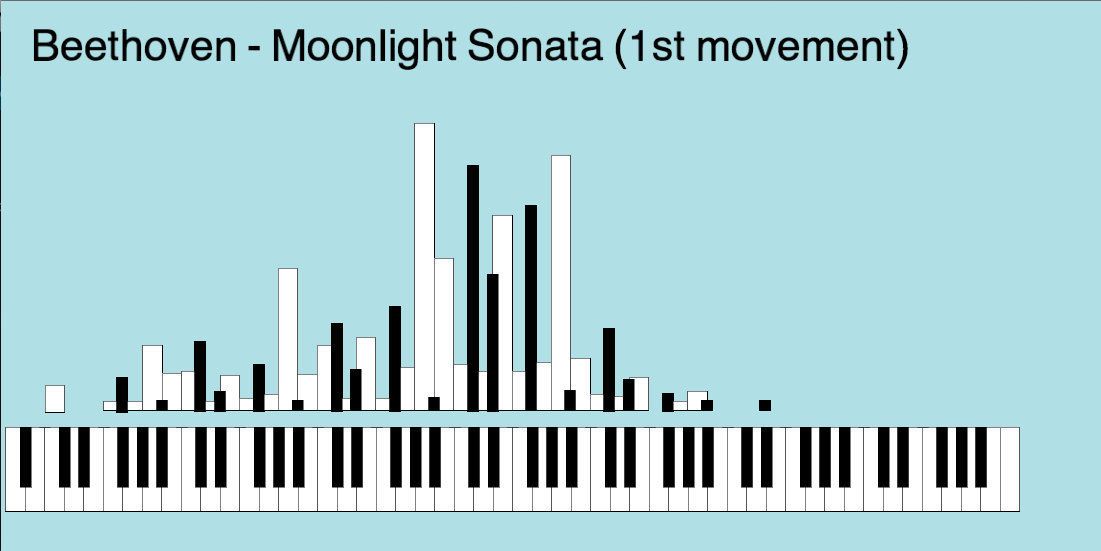
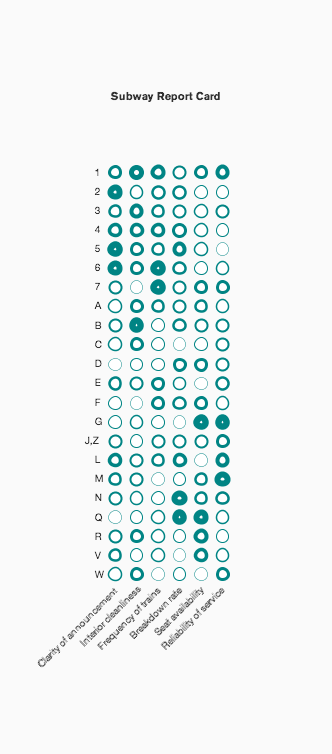
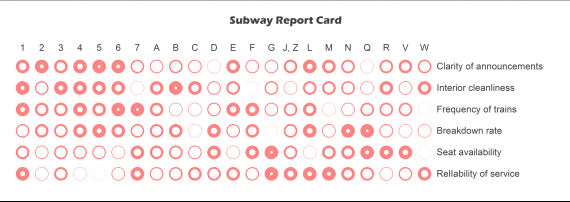
This visualization shows how many times each key of a piano is being hit while playing Beethoven’s Moonlight Sonata. code: beethoven original >> This viz is about the quality of service of MTA focusing
on 5 different aspects.
It is all hard-coded … code:subway report card original>>
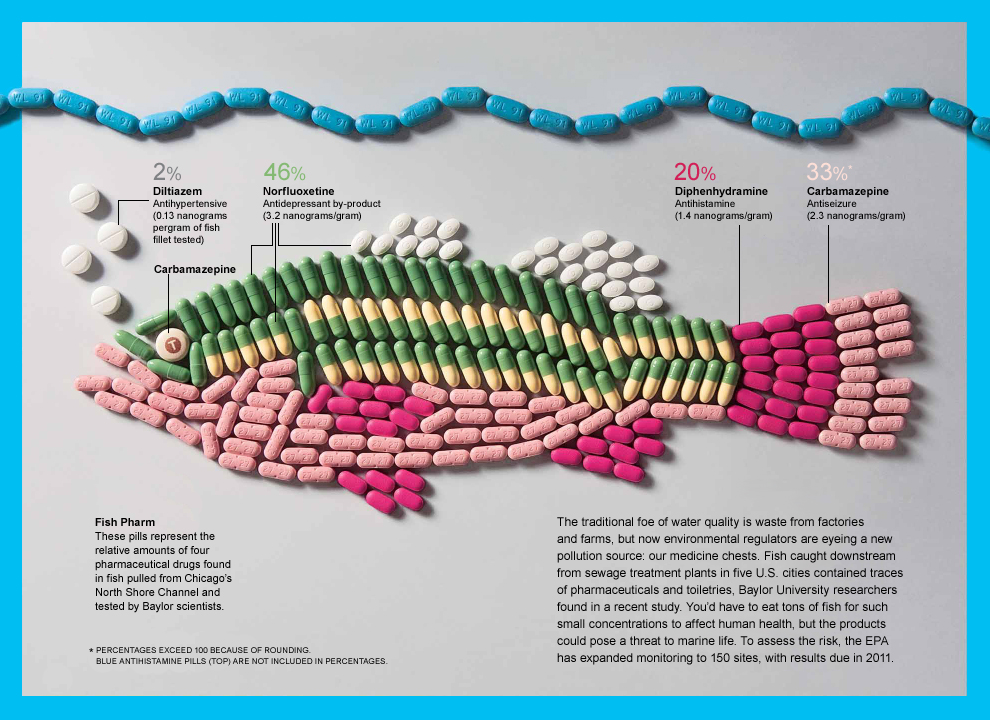
I thought this was an interesting site in the view point of artist and designer, although these designs are not meant as data, I felt it was a great representation of data on an uncommon medium.
Info. Graphics on the body
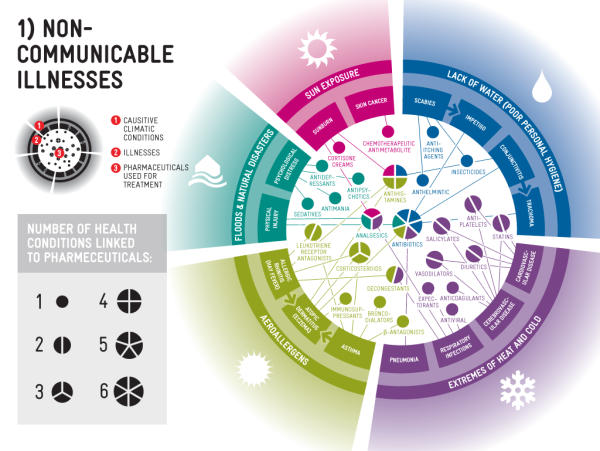
Info. Graphics I use to work for a Pharmaceutical advertising company
and I thought it would be a good to highlight some of
Info. graphics used in that industry. Some of the marketing
materials these companies use are unbelievable, I once read this on
a new campaign this was what was said in a nut shell COPD is a new disease in the market and has great market potential for the Pharmaceutical Industry.
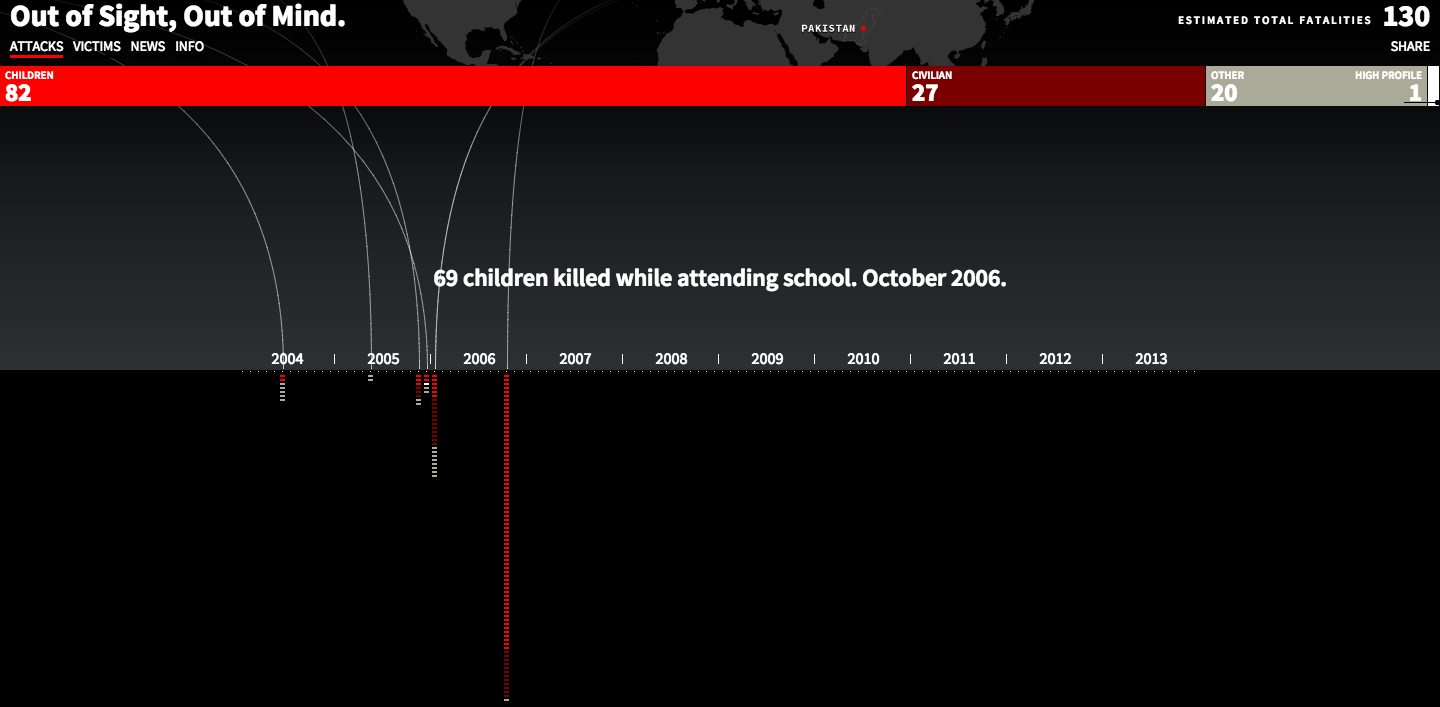
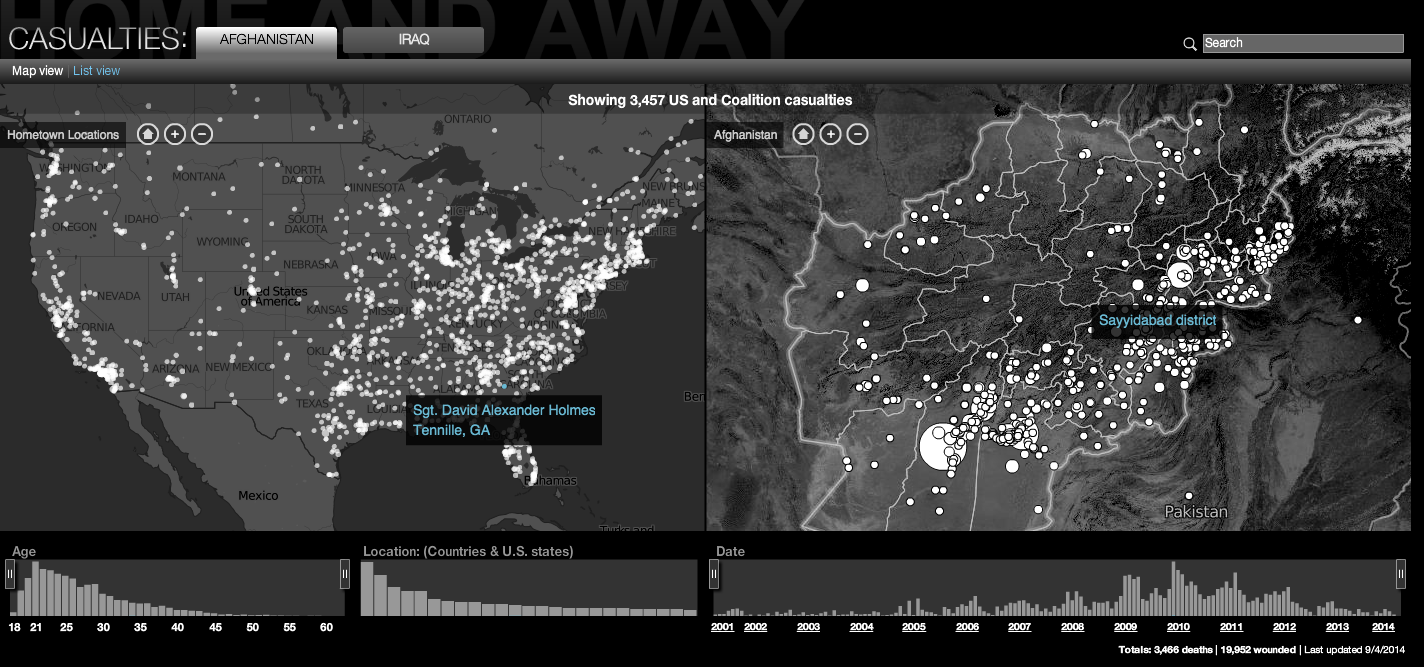
A Visualization Both these links display interactive data visualization
showing the perspective of two side of the war in the
middle east. The first one shows how the war is being fought with
drones and the rise in casualties. The second link display the casualties of the solders fighting this war from different countries
and the two was in Afghanistan and Iraq.
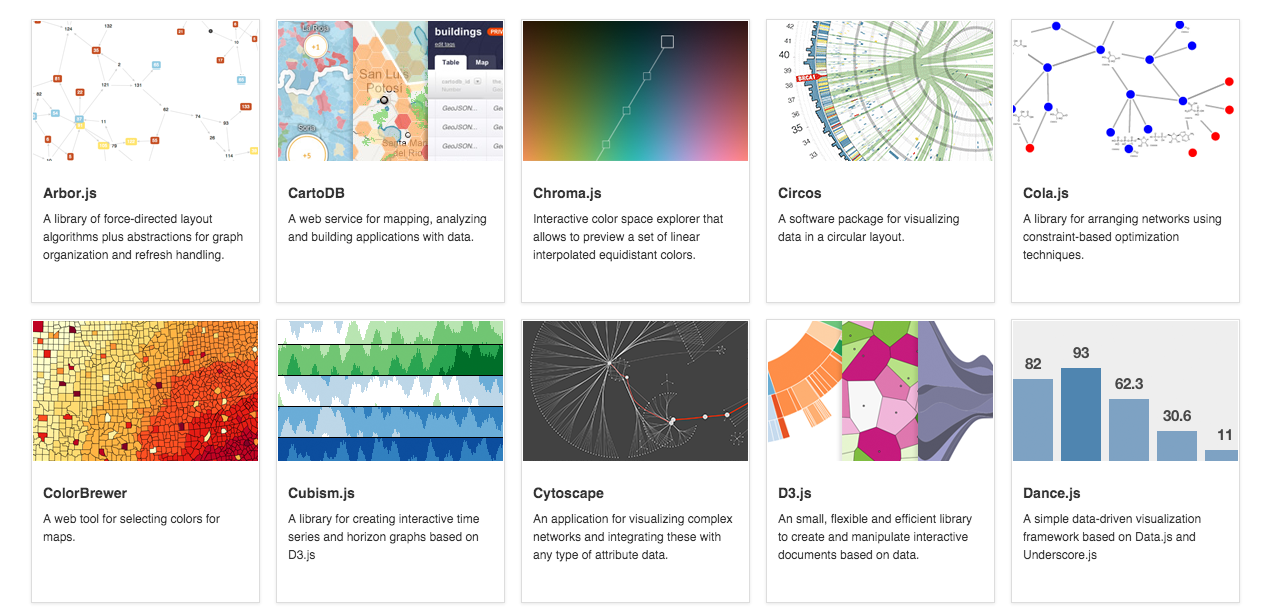
Below are four different links to Data Visualization Tool.
The first is to datavisualization.ch which shows examples of
different data visuals languages; Javascript, Processing, Flash
Java and others. What I liked the most about this first site is all
the great examples and links to those web-sites which provide
code and additional examples. The other three links provide additional info. on code , examples and other processes such as storyboarding.
Data Collection Tool I was really sure where to look for these but
or what words to use besides the Data Collection Tool
to search in the browsers but below I think these two might
help in collecting data.
Discussion Forum A point of view is a blog that deals with Data in the different points One in Visualization, Design Process, Elements of Visual styles and the story telling of data. There were many other blogs out there but I felt this blog discussed a lot of components of Data, Graphics, Process and visuals to name a few. A point of view
Criticism The MIT blog Tech Review is making a Criticism the big changes happening in Software Development and open source code or as they put it “social coding web-sites” such site as GitHub and BitBucket have impacted this change.