Instagram API
I was originally intending do something with the Instagram API. I wanted to be able to color analyze and geolocate the most popular photos of a certain hashtag. I looked up Color Thief.js, as suggested last week, and it looked great. Except the major portion of what I needed came from the Instagram side of things and that was not working out.
I had set up the account and got the Client ID and tried to get the data to my site. It is not working for me. It doesn’t help that I don’t even know if I set up the account right (I have a Client ID and Secret) but every time I Google for help every site takes me back to the same place – Instagram. There IS a lot of information there but I can’t make any sense out of it. So I tried looking for third party help such as Instafeed, or this, or this helpful site by IBM, and this helpful Github site. All I ended up getting was a blank page or an error message. Which makes me believe I’m not doing something right…(also don’t know how PHP works). Here is what I thought might be a hopeful working sample (it was not).
Interactive
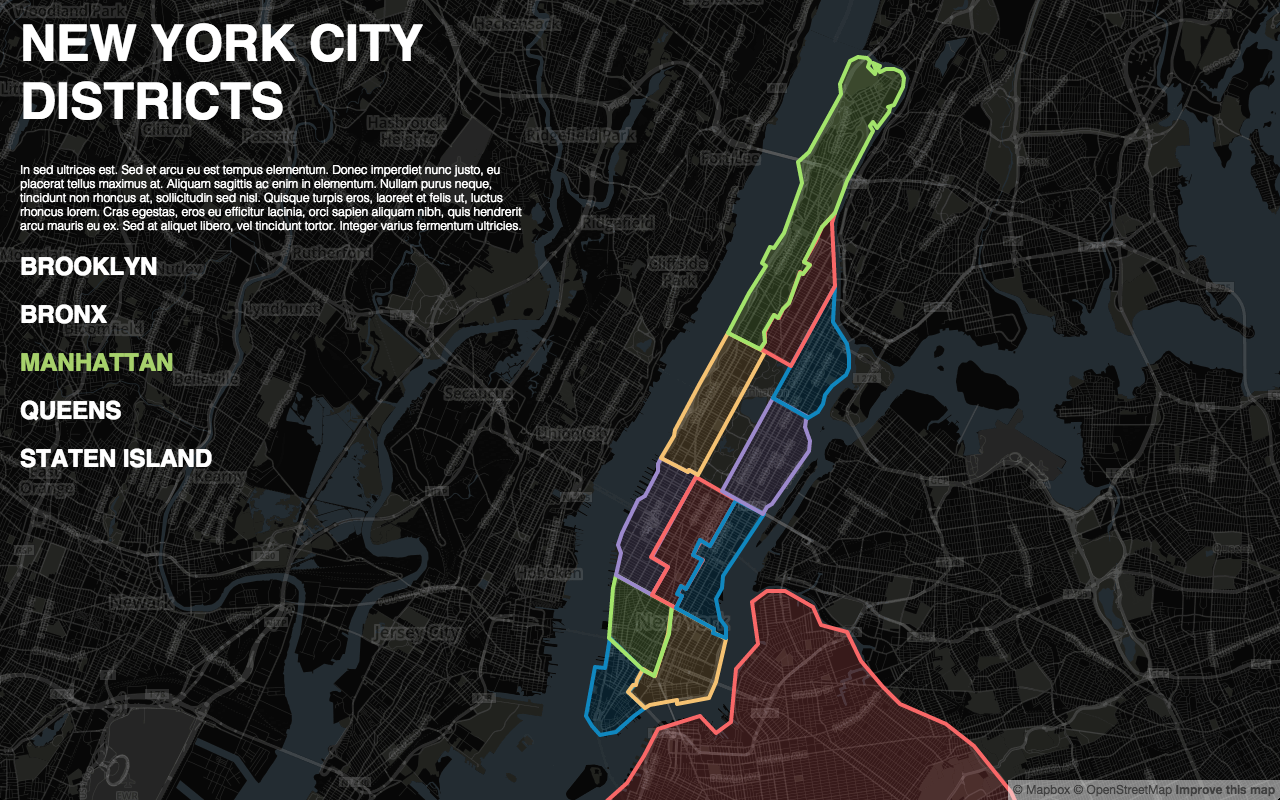
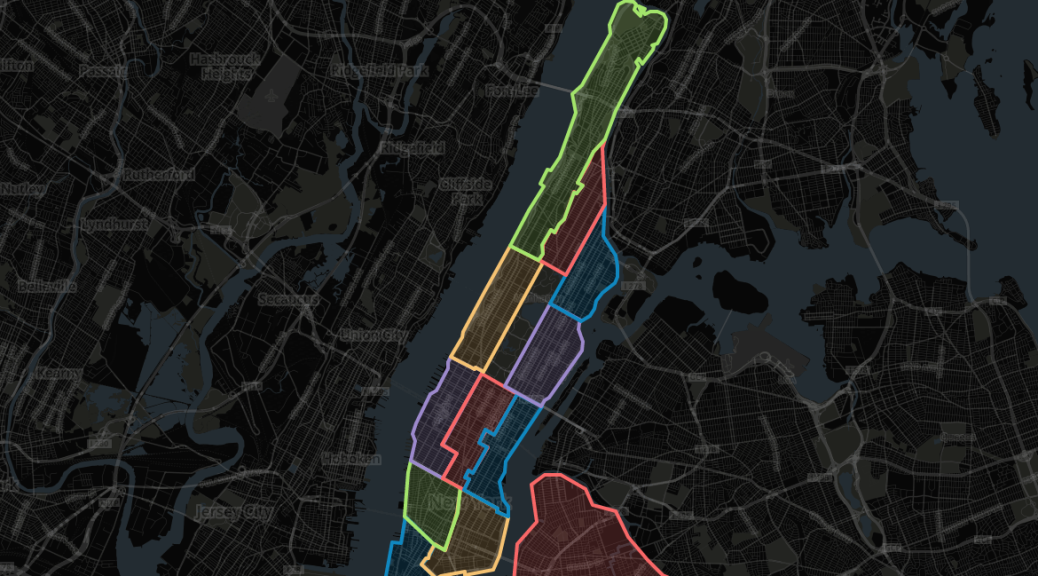
So for now, I decided to work on an interactive map of the New York City districts as to compare the living and economic situations. It isn’t too far from what I needed for my original idea so if I get that API stuff working I can just incorporate it into the map.
Data
POCs
1. Interactive Map – click places on the map and have stuff show up. (Mapbox is awesome.)
2. Stuff that shows up should be relevant – as I was working on the map I was having a hard time getting the polygons on the map to interact with my side of coding. So for now, I got a way to put infographics into the description of each district.
3. Pie Charts