Data Visualization Aggregator
Spurious Correlations
This site is hilarious. It serves as a reminder that it is important for everyone who collects data to remember that correlation does not mean causation.
A Visualization
NYC Crime Map
This is important for everyone who lives in NYC (though it may cause slight paranoia, I found out there was a rape across the street from my home). Do not forget that the city sponsored this, it may be biased.
Artist/Designer
Marc Inignac
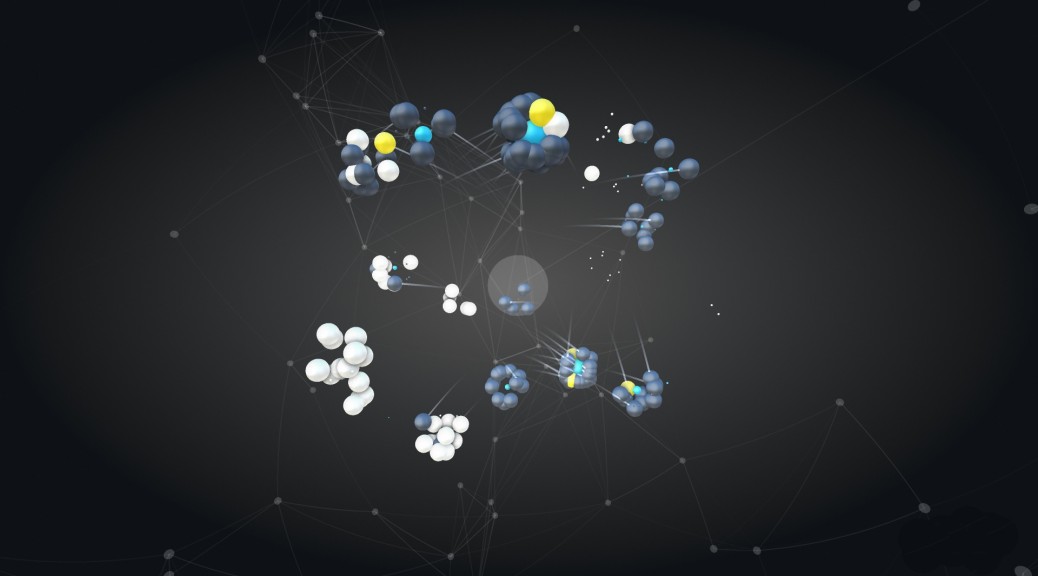
His work is beautiful but hard to read so it is more about aesthetics than function. However, he does have a lot of experimental visualizations that would interesting to take further.
Visualization Tool
Many Eyes
You can just upload a data set and then choose the type of data visualization. Boom. Done.
Data Collection Tool
Microsoft Excel
Good for personal data collecting and can be attached to other applications. It can also provide its own data visualizations (though not amazing).
Discussion Forum
Datavisualization.ch
A whole site dedicated to data visualization new, discussion, and even data sets.
Criticism
The Cartography of Peevishness
This criticizes “The Map of Racial Tolerance” published by The Washington Post and how the visualization is not correct because the data itself has problems with it.
Data Source
World Health Organization Data Repository
Data collected from all over the world about all sorts of diseases and other health issues.
Data Ethics
Why You Should Never Trust Data Visualization
This article talks about how skewed data visualizations can be and provides many links to examples.
A Book
Form + Code
This books shows not only data visualizations but how artists and designers are creating new visual forms using code.