I was reading this week’s issue of Time Magazine “The Answers Issue” and it was just filled with cool infographics. I came across “Where do babies come from?” and thought it was an interesting article. Link to it here (it has the actual chart online, I just do not have a subscription) and the source it uses is here (which is another data visualization). Here is a scan of the physical copy:

The chart compares adoptions in 1999 and and in 2013. The issue with it is that it uses squares to represent the numbers and that the width and height of the square change according to the number. This makes it a little difficult to proportionally compare the squares. Also, the squares are in seemingly no order. One can see that the jumble of squares representing 1999 is larger than 2013 but not exactly.
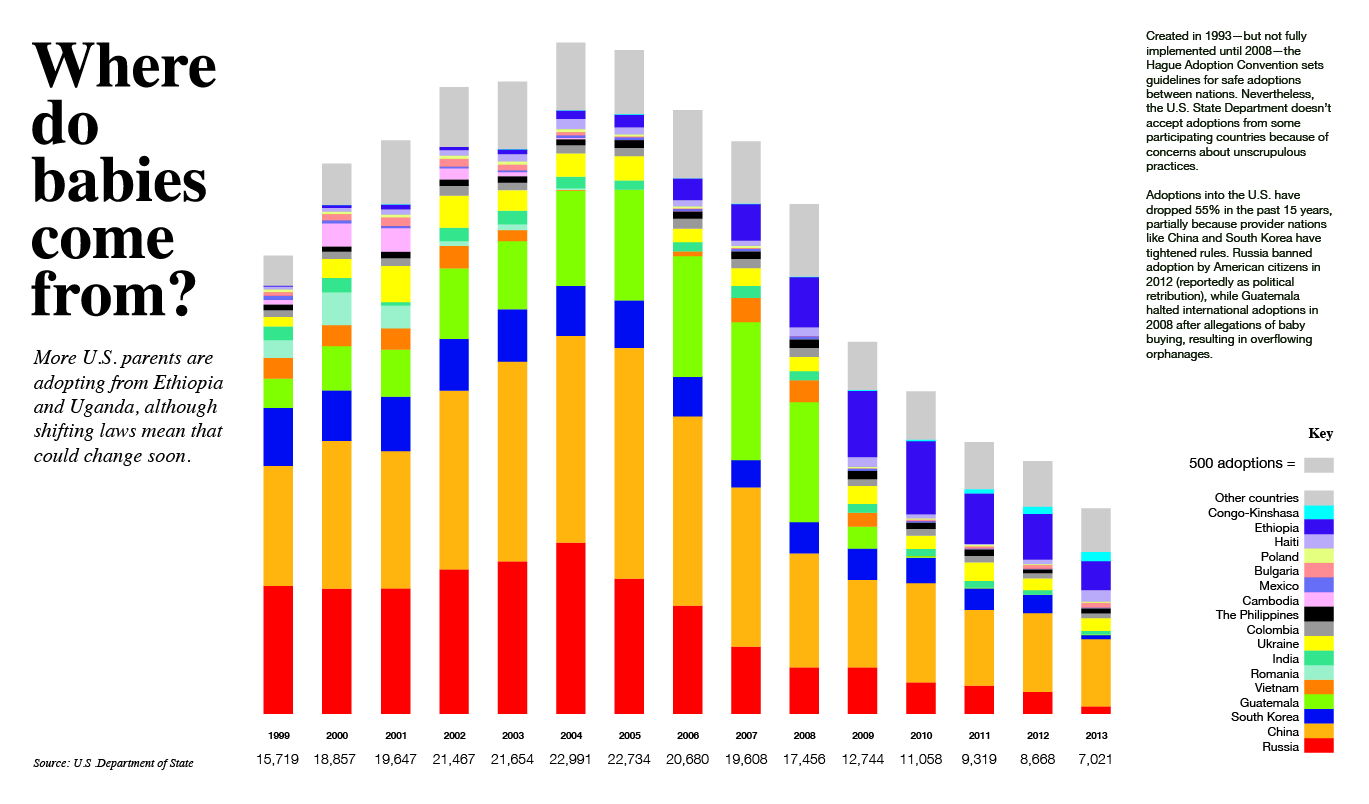
For the makeover I made the numbers visually proportional to each other in a stacked bar graph; this way it is easier to compare two numbers. In my chart, I also decided to add more information between the years so that a trend can be seen. I also decided to keep all the countries listed from 1999-2013 so that none of the countries just suddenly disappear (like in the original one).
PDF: Adoption