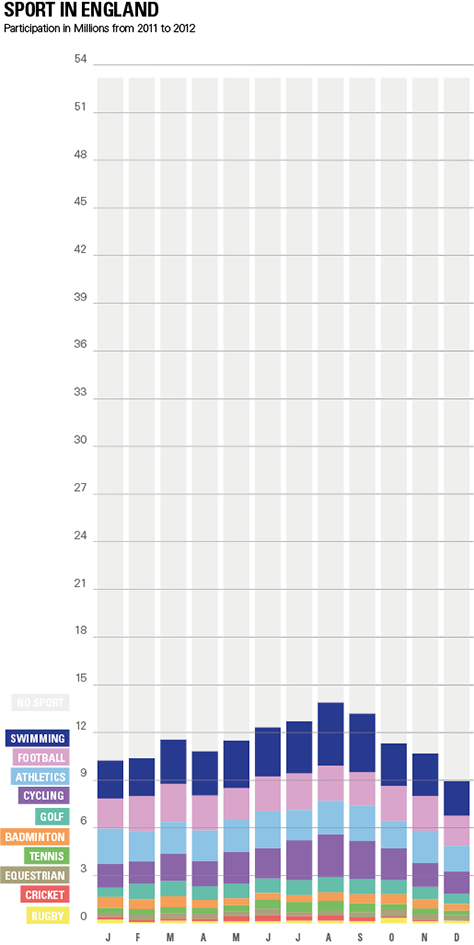
So I found this Infografic in one of the blogs that was posted by the class. It compares what kind of sports people in England did in the year 2005 and 2011. There are several problems I had with this visualization. Why does it compare these two years? The scale for each sport is differnt so its hard to compare them. There is a lot of text and the people, which don´t do any sports are not mentioned.
In my makeover I focused on a more general overview. The smaller sports are not equal to the big ones and you can easly see which sports could be called “others”. Also the trend in summer in more clear. I left out the comparison to 2005, because it was not obvious to me why to compare it with this year.