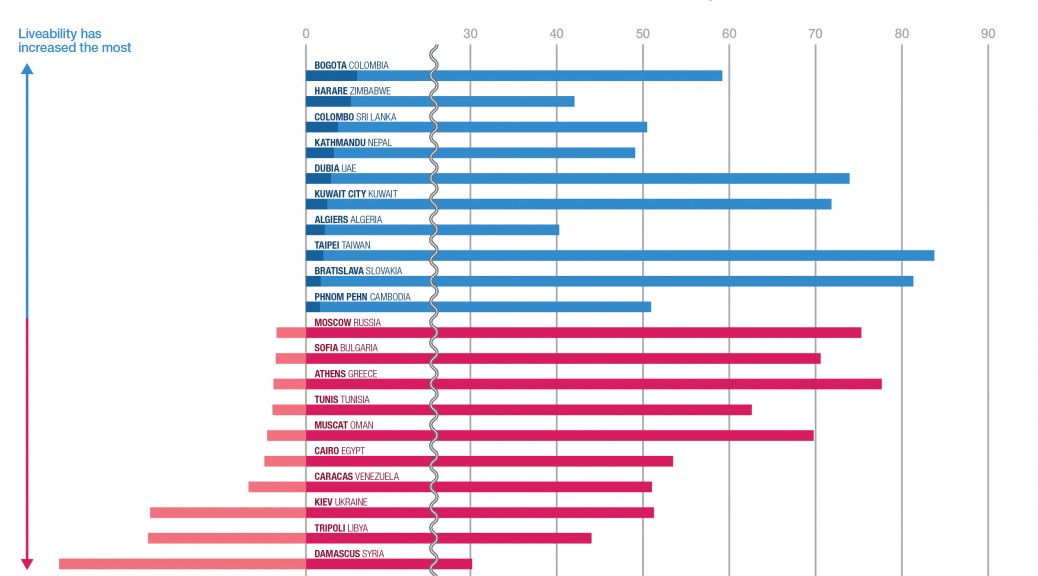
While I was browsing the web to find an infographic for the makeover assignment, I found an article on The Economist including this interesting infographic that compares the most liveable cities.
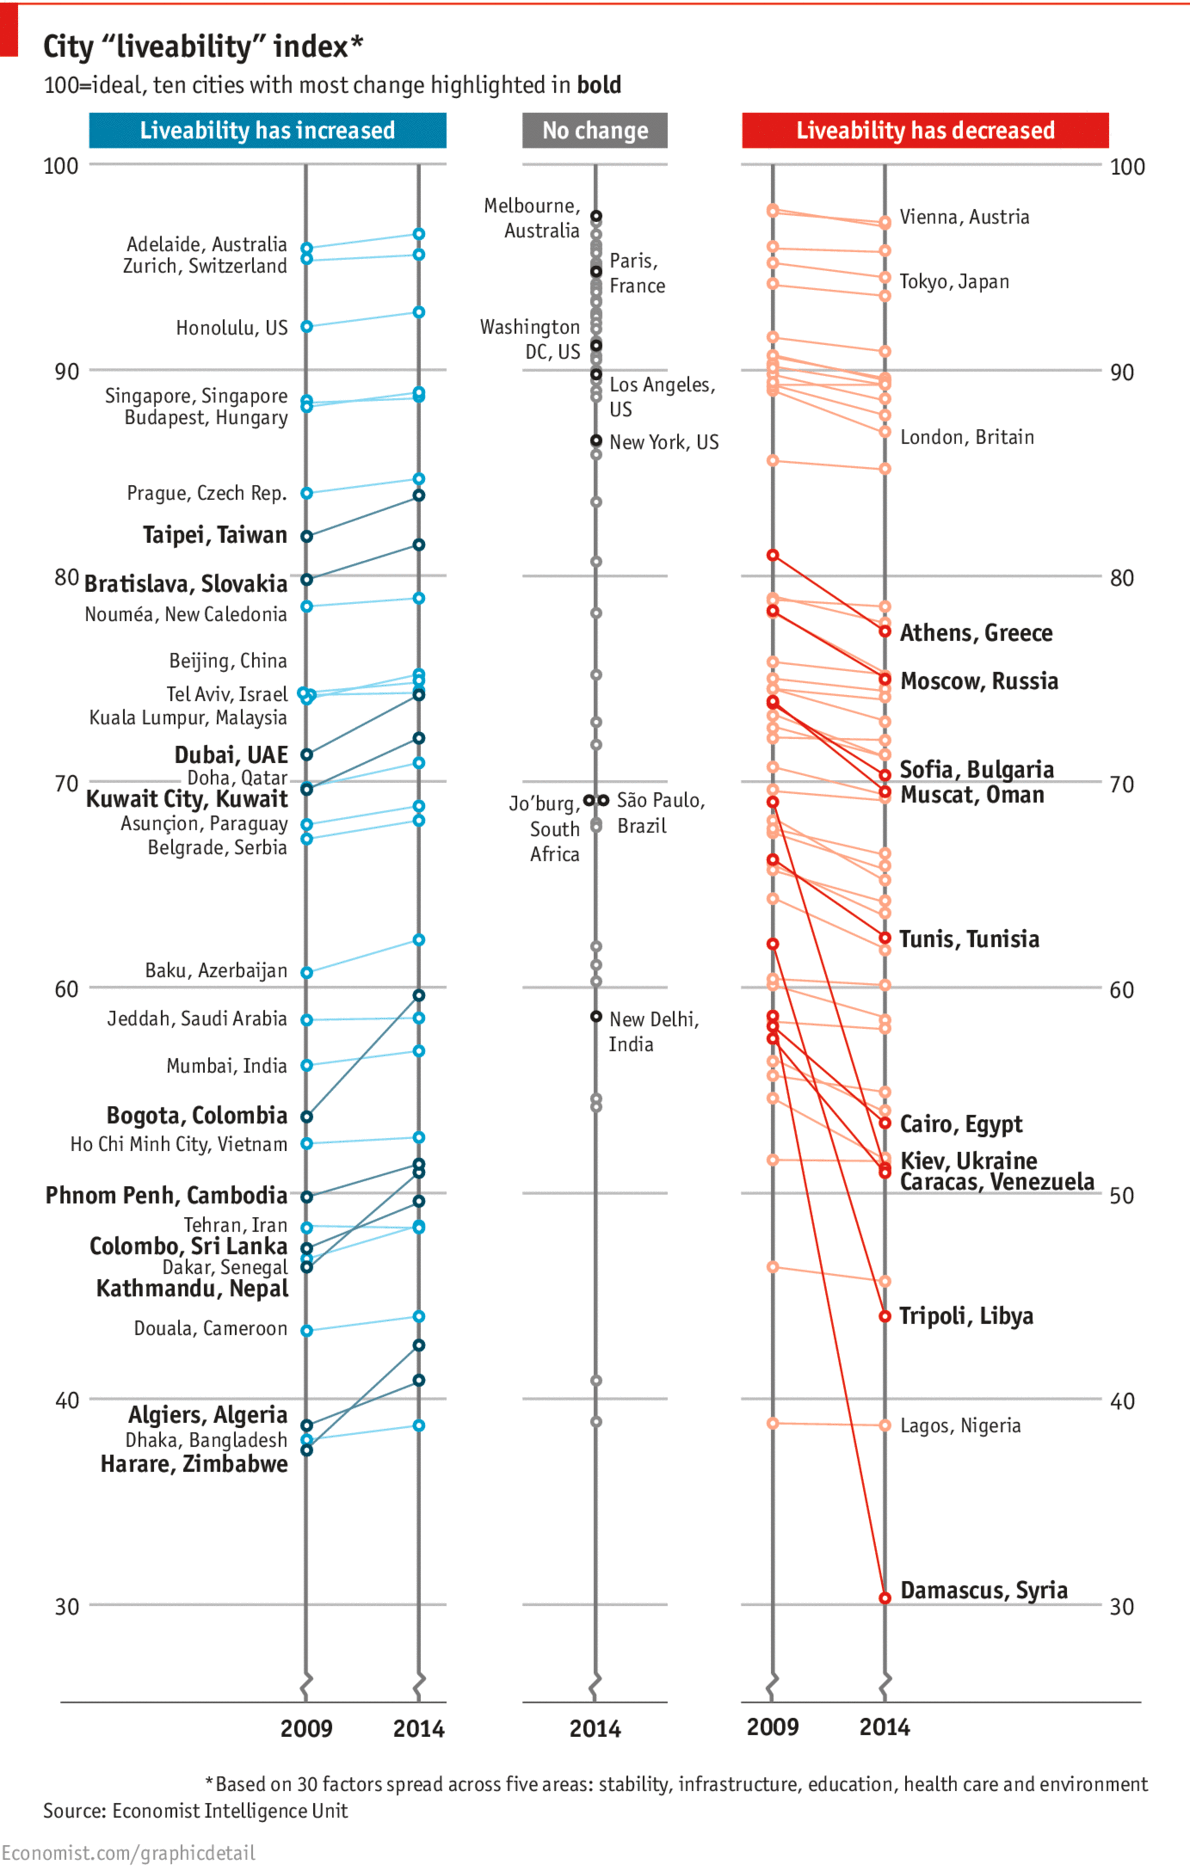
The infographic separates cities into three different groups where liveablity has increased, not changed and decreased. Each cities are grouped quite clearly, yet I am confused about some ways in which the data is presented: firstly, why there are dots that do not have their name on each line, secondly, which standard determines if each dot has its name or not, and lastly, why there are even cities that have no change shown.
I think all the questions come from excessive omission of the infographic. The infographic coveys quite comprehensive data, but since it takes away the most important information, like the name of the city, it is questionable that the infographic is intended to selectively show just some cities that have the most change of liveability.
To make the infographic clearer, I’d rather simply take some more intriguing part out of it and focus on that: cities where the liveability has increased or decreased the most.
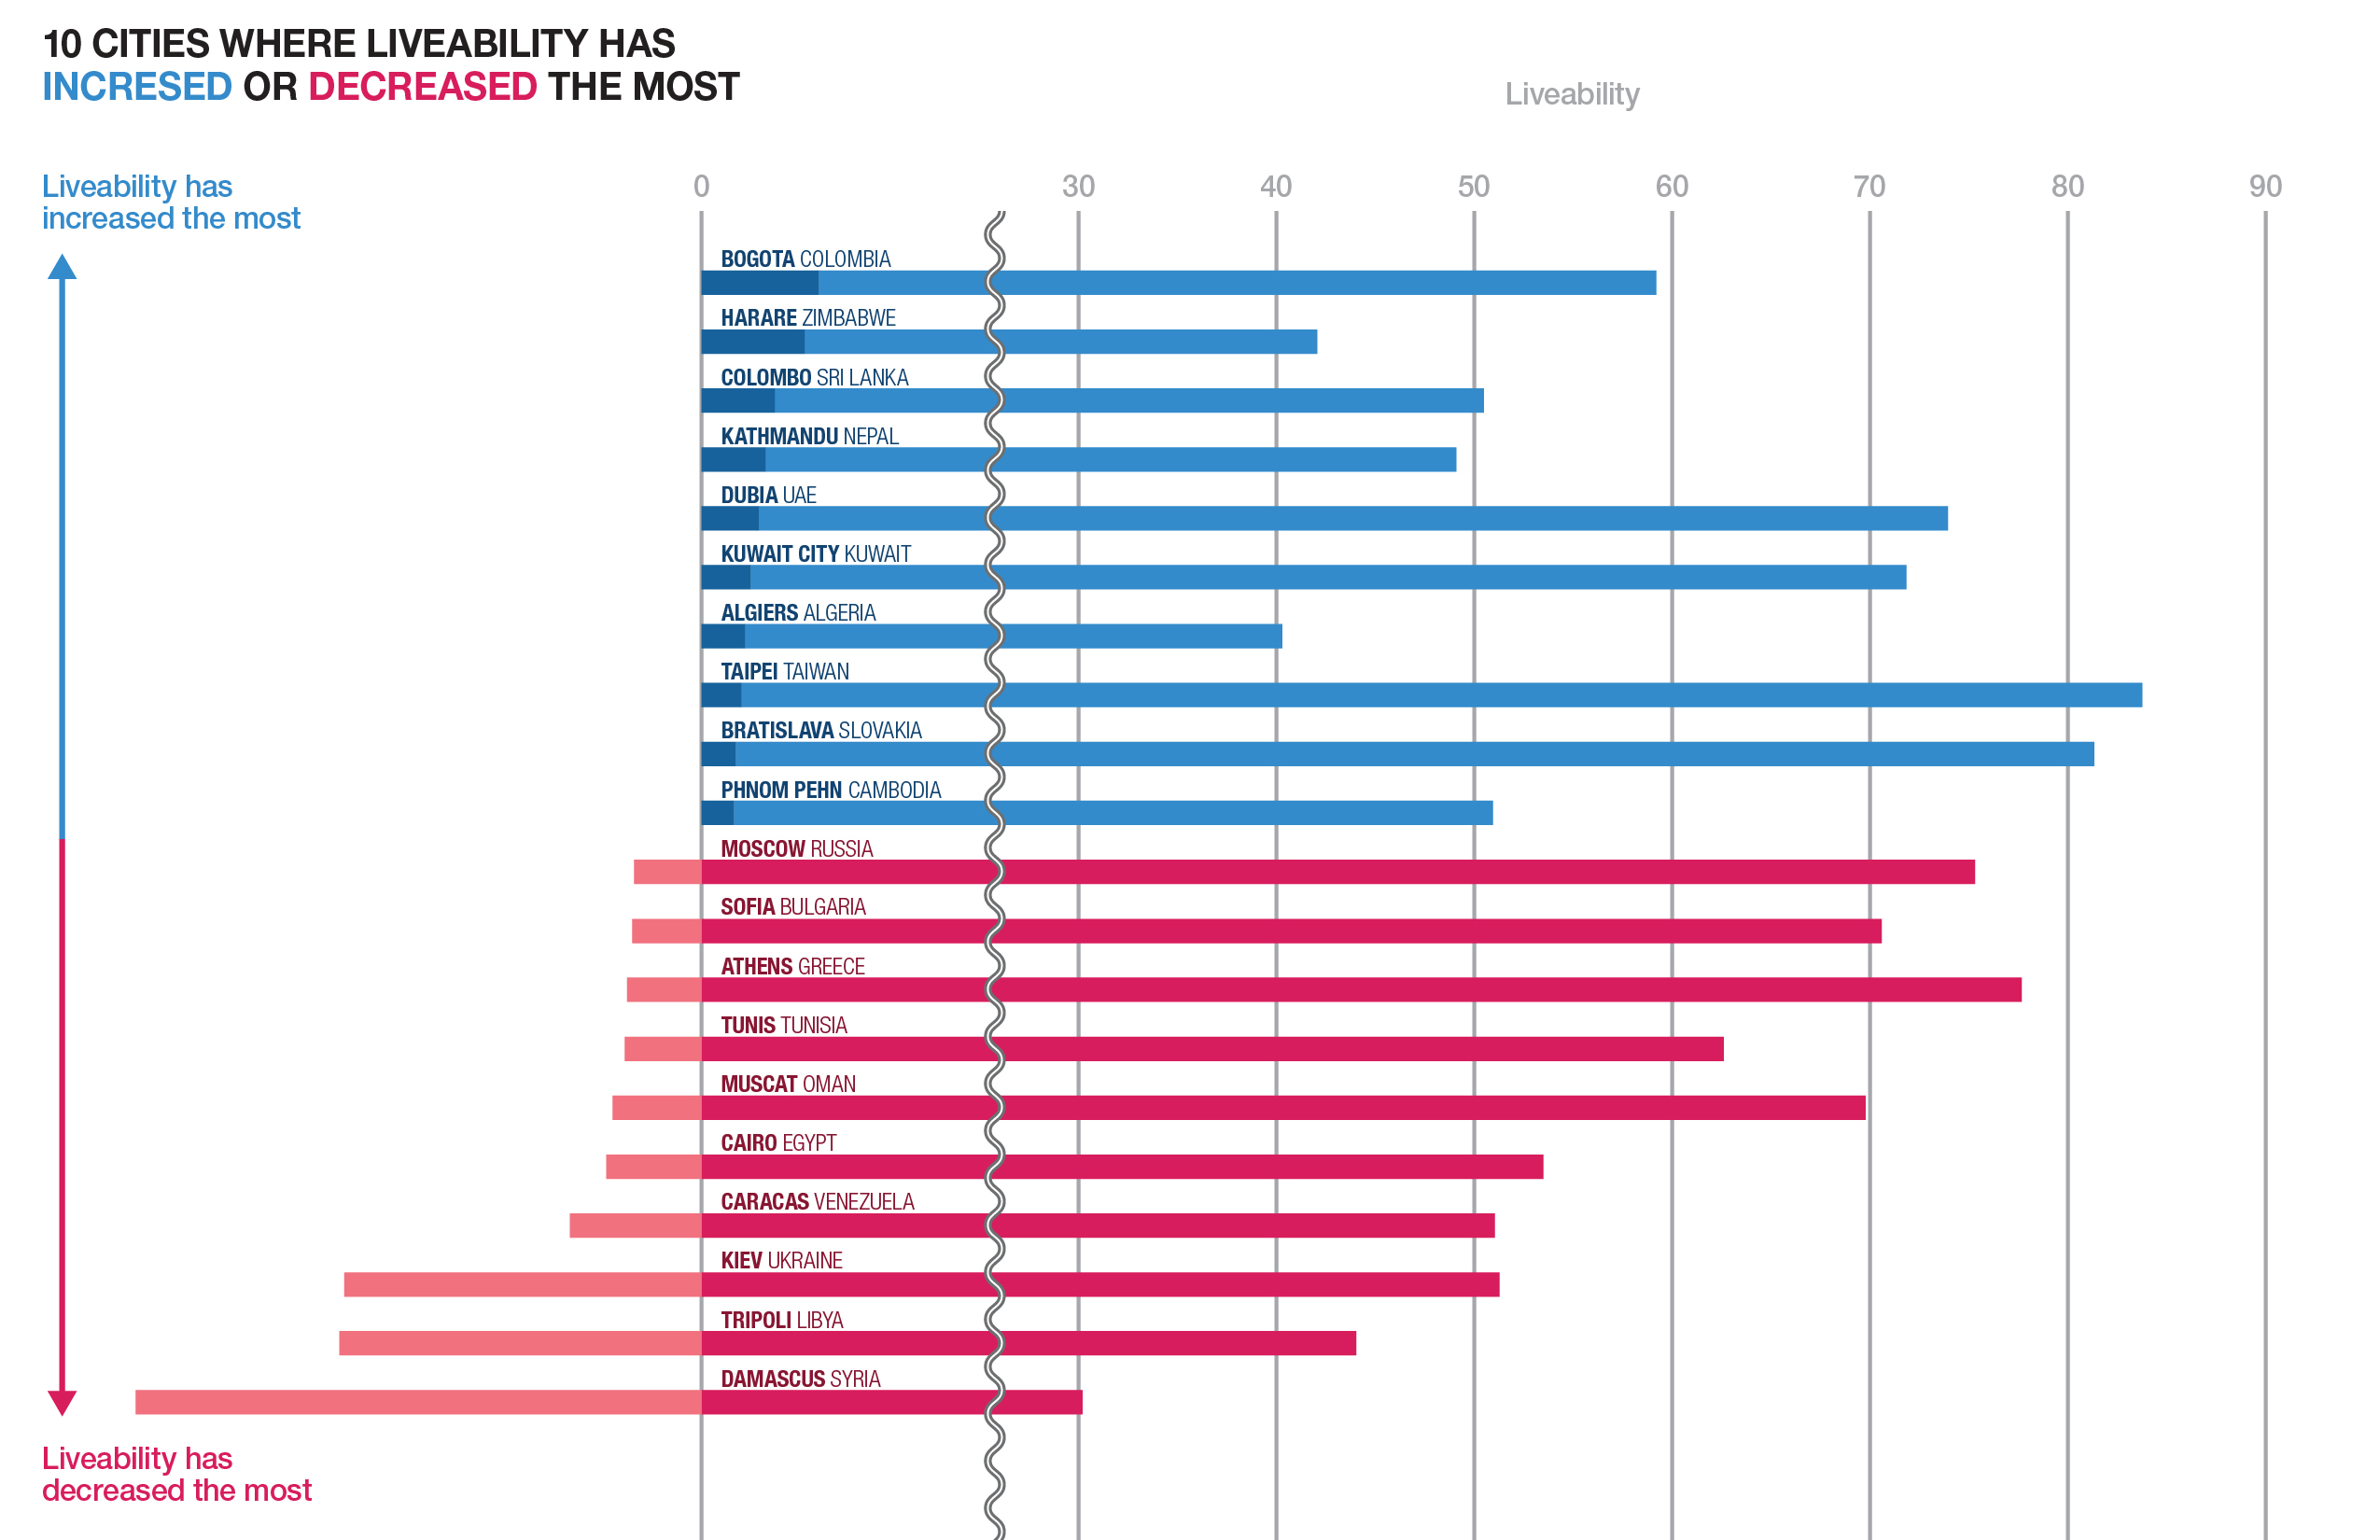
I re-sorted out cities depending on their increase or decrease so that it is easily recognizable that which city shows the biggest growth or decline. In addition, you could find out the fact that the bigger decline a city has compared to past, the lower liveability the city tends to score in the present.