SUBJECT:
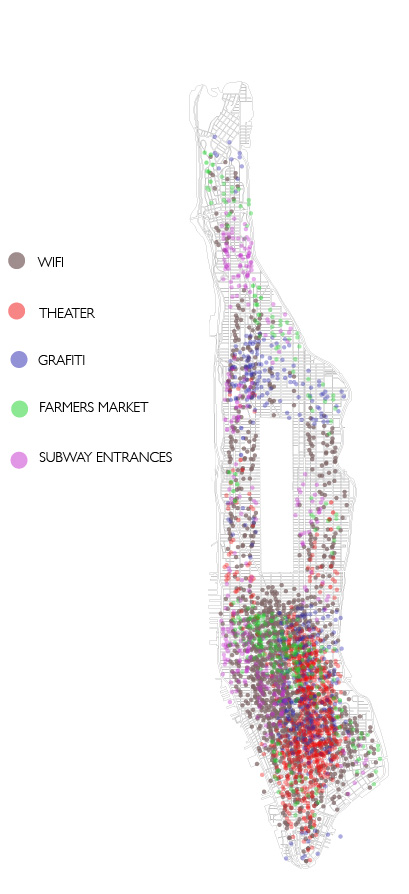
My poster will be mapping different locations within New York City. For example, one of my categories is called “Subway Entrances”, which means I will be mapping all of the subway entrances within Manhattan. I will be placing the location of each subway entrance by displaying a small dot with a specific color, indicating the exact location of the subway entrance. My data visualization will illustrate a clear congestion of dots within certain areas of manhattan. This will suggest that a lot of people are usually around that specific area, while the areas that have less dots will led one to think that there must not be as many people in that specific area.
DATA:
I started to accumulate my data from data.gov, which lead me to New York City Open Data. After looking through a lot of different information, I thought it would be fascinating to indicate where certain things are located in Manhattan. With that said, I downloaded CSVs from their website that located unique things.
The data I have is different locations of:
– Wifi
-Subway Entrances
-Graffiti
-Movie Theaters
-Farmer Markets
TOOLS AND APPROACH:
In order to understand the best way of visualizing this information, I will create a plot graph on New York City. I will create small dots that are different colors to display the different categories and locations. Some of the dots will be very close together and possibly overlap.This will indicate that a specific area is busy and congested, while an area that has less dots or only a specific color of dot will be viewed as less commercial and more residential or just simply less congested.
DESIGN: