Discovery / Proposal
Subject
For this assignment, I want to visualize a set of data that represents my current area of interests about urbanism and issues in urban areas. I’ve decided to research on data concerning the particular interests I have because when I researched about data visualization for the second assignment, which was about livability of cities, I was wondering if there was a link between the livability and the scale of each city. I think this is worth questioning because, at least to me, it is assumable that people would expect better livability when it comes to big cities, and this supposition could support the reason why one city grows: better living conditions. My poster of data visualization will show the growth or decline rate of population of each city, and any relatable facts that explain such growth and decline.
Data
I found my primary data about Population of Urban Agglomerations published by The Population Division of United Nation. The data collects every city that has more than 300,000 habitants in 2014, and shows periodical growth or decline from 1950 to 2030. The data is estimated from the most current available census or official population estimate of each country. Even though I was not able to find livability data for all the cities nor other citywide data as vast as the one that I already found, I could connect one secondary nationwide data that explains increase or decrease of population of each city within the nation.
Tool and Approach
The data is very neatly organized and able to be simply altered to a csv file, so I don’t need something else to do for the data arrangement. Besides, I will mainly use both Processing to visualize data and Adobe Illustrator to edit visualization. In order to explore the best way of visualization that can be visually appealing and precisely executed, I might need to sketch out several ideas of visualization before moving on to the Processing part, although the possible visualization concept would be either mapping out on a map, or lining up and spreading out on a circular line.
Comp
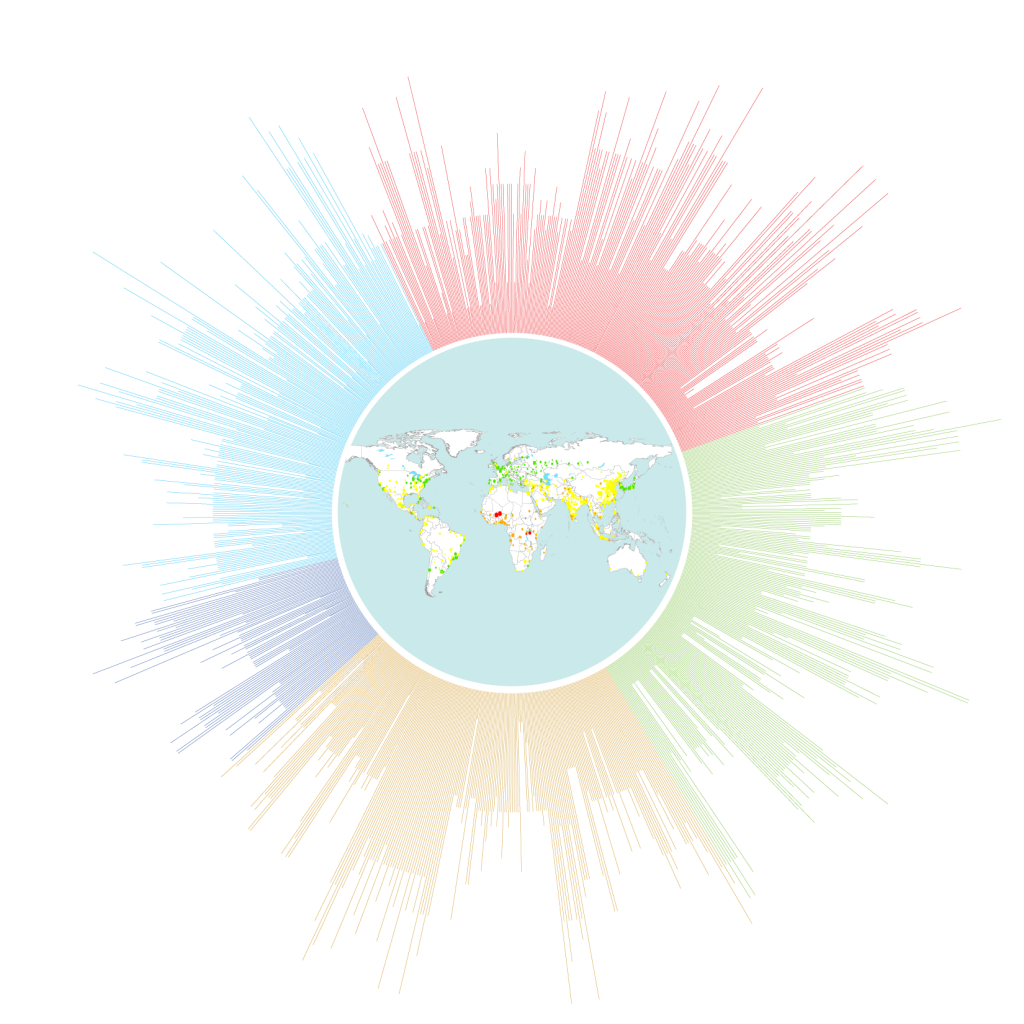 comp
 comp(detailed view)
Proof of Concepts
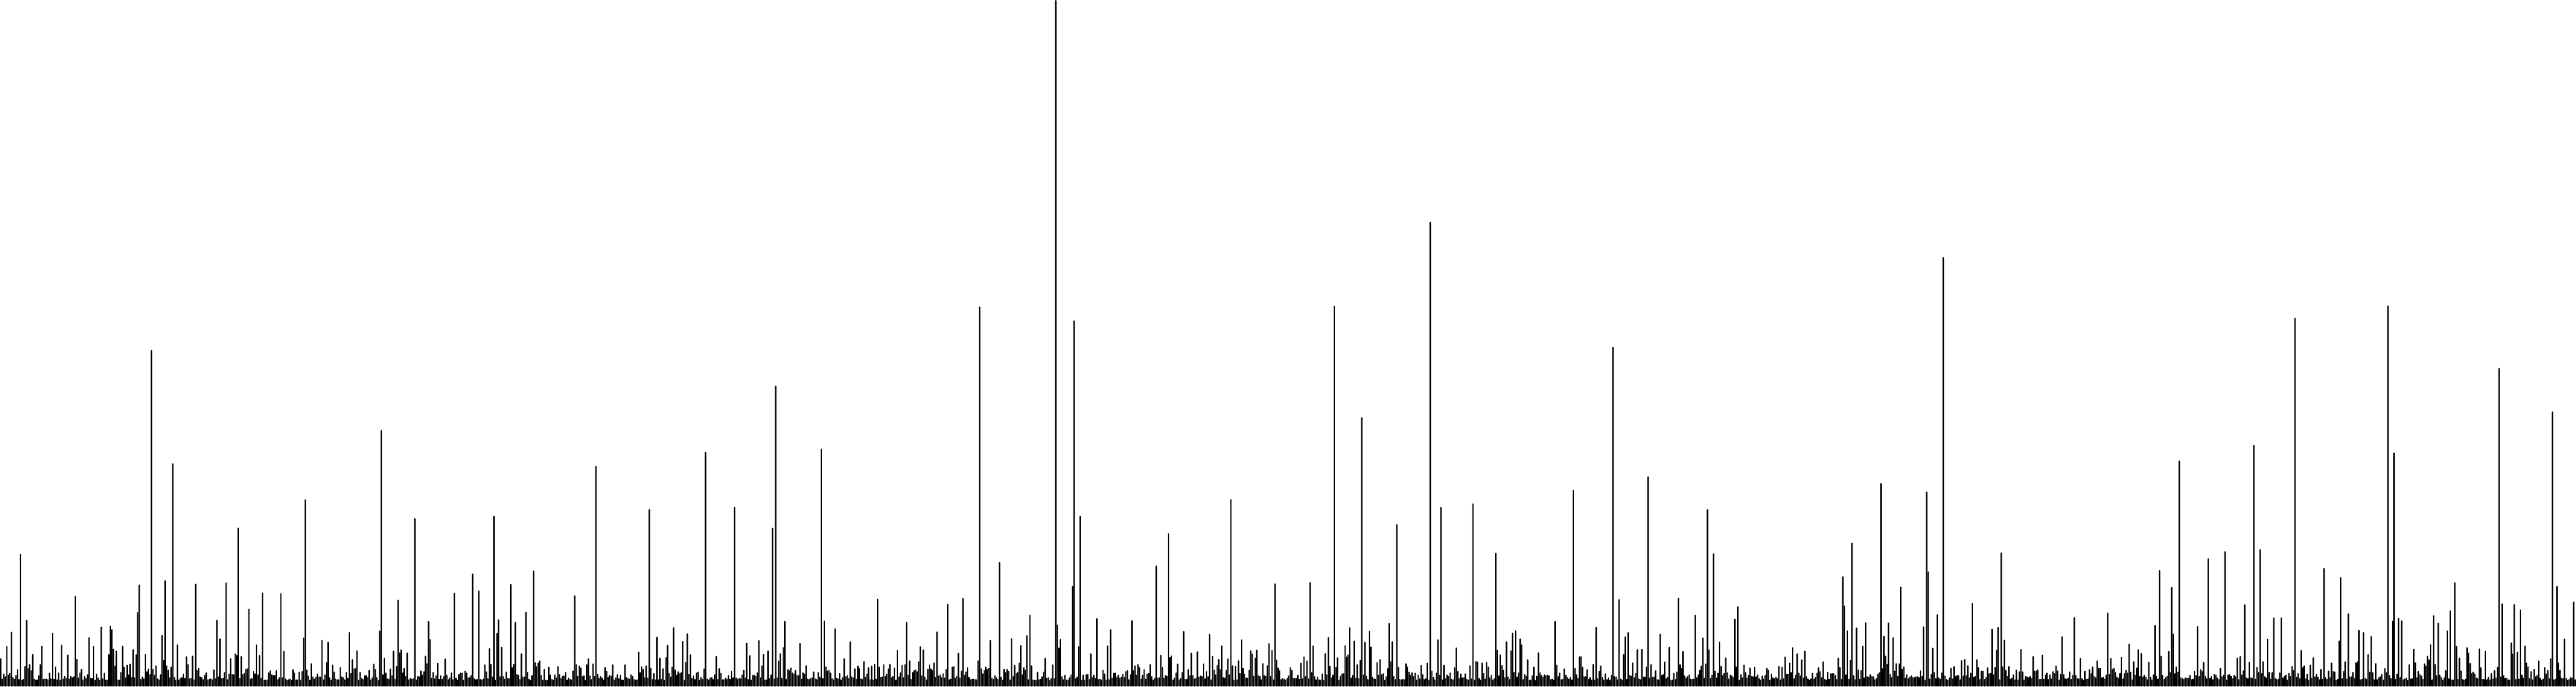
First, I was able to get a population data from a csv file, and draw lines that represent corresponding cities. I made a “drawLine” function and wanted the lines to be spreading out on circular direction. But the data is too vast to be spread out because the angle to rotate the matrix is too small. So I just lined them up for now.
pdf POC
code POC1