
Cities We Live In (pdf)
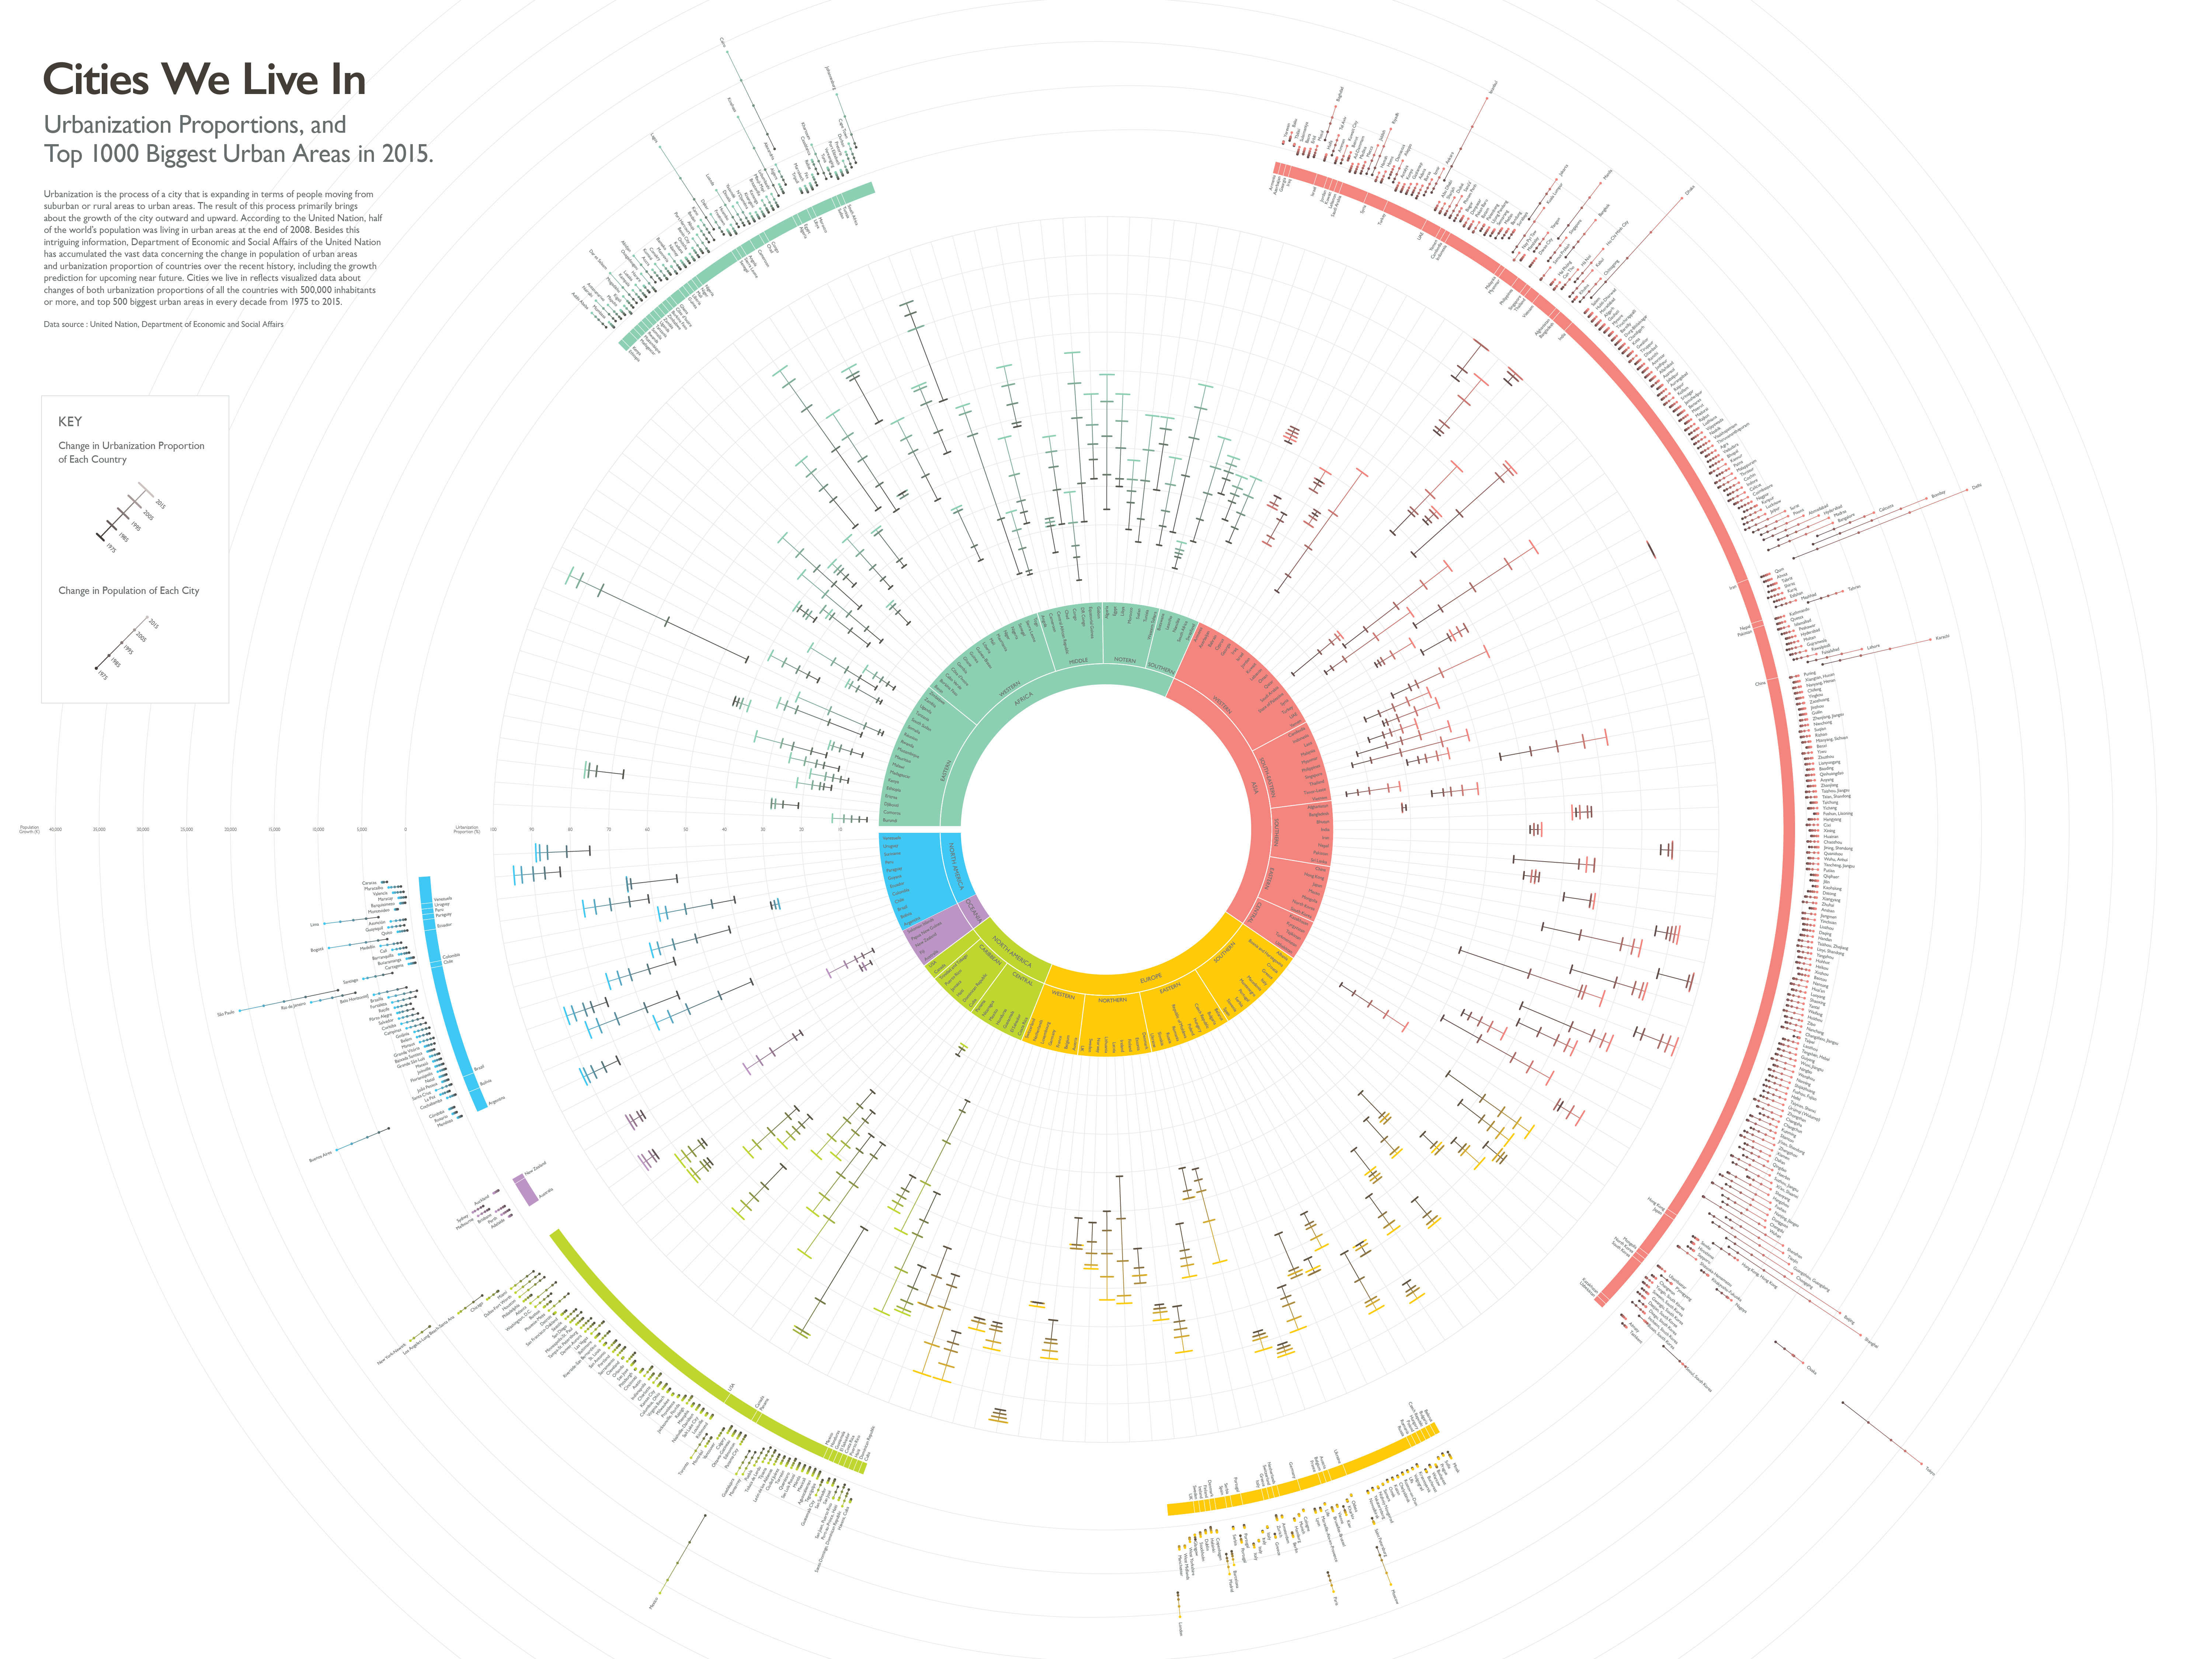
Overview
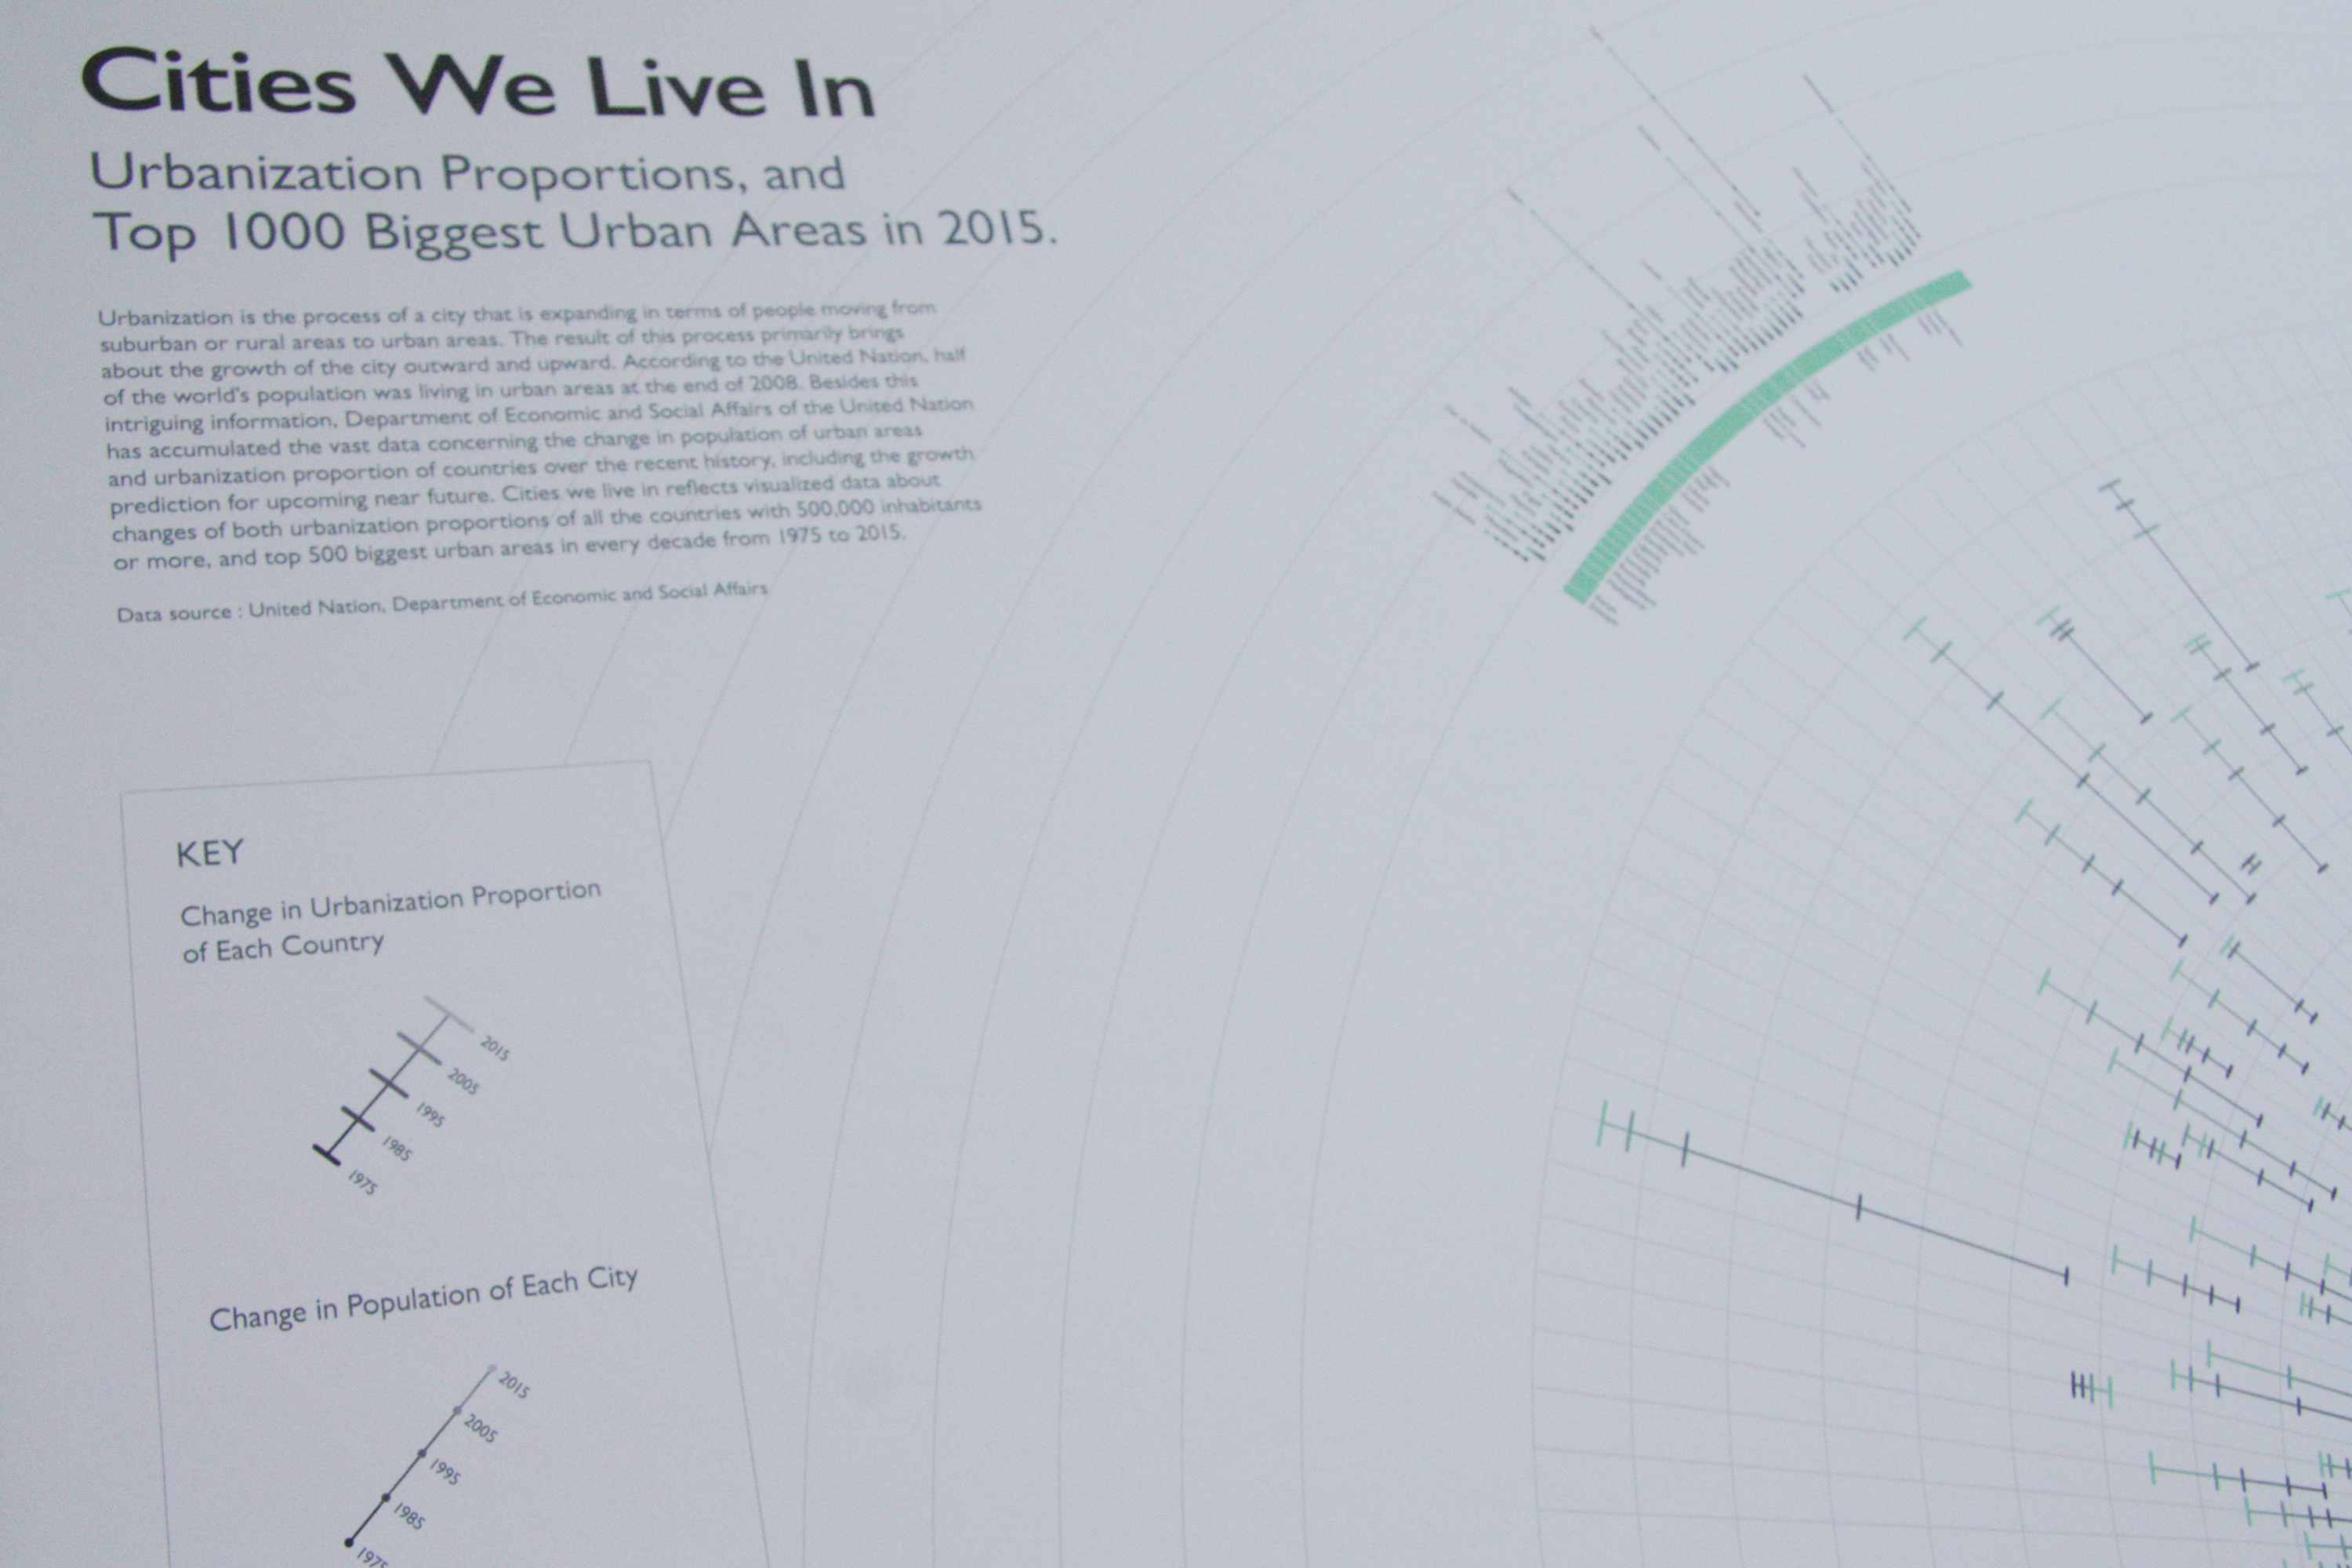
Detailed View

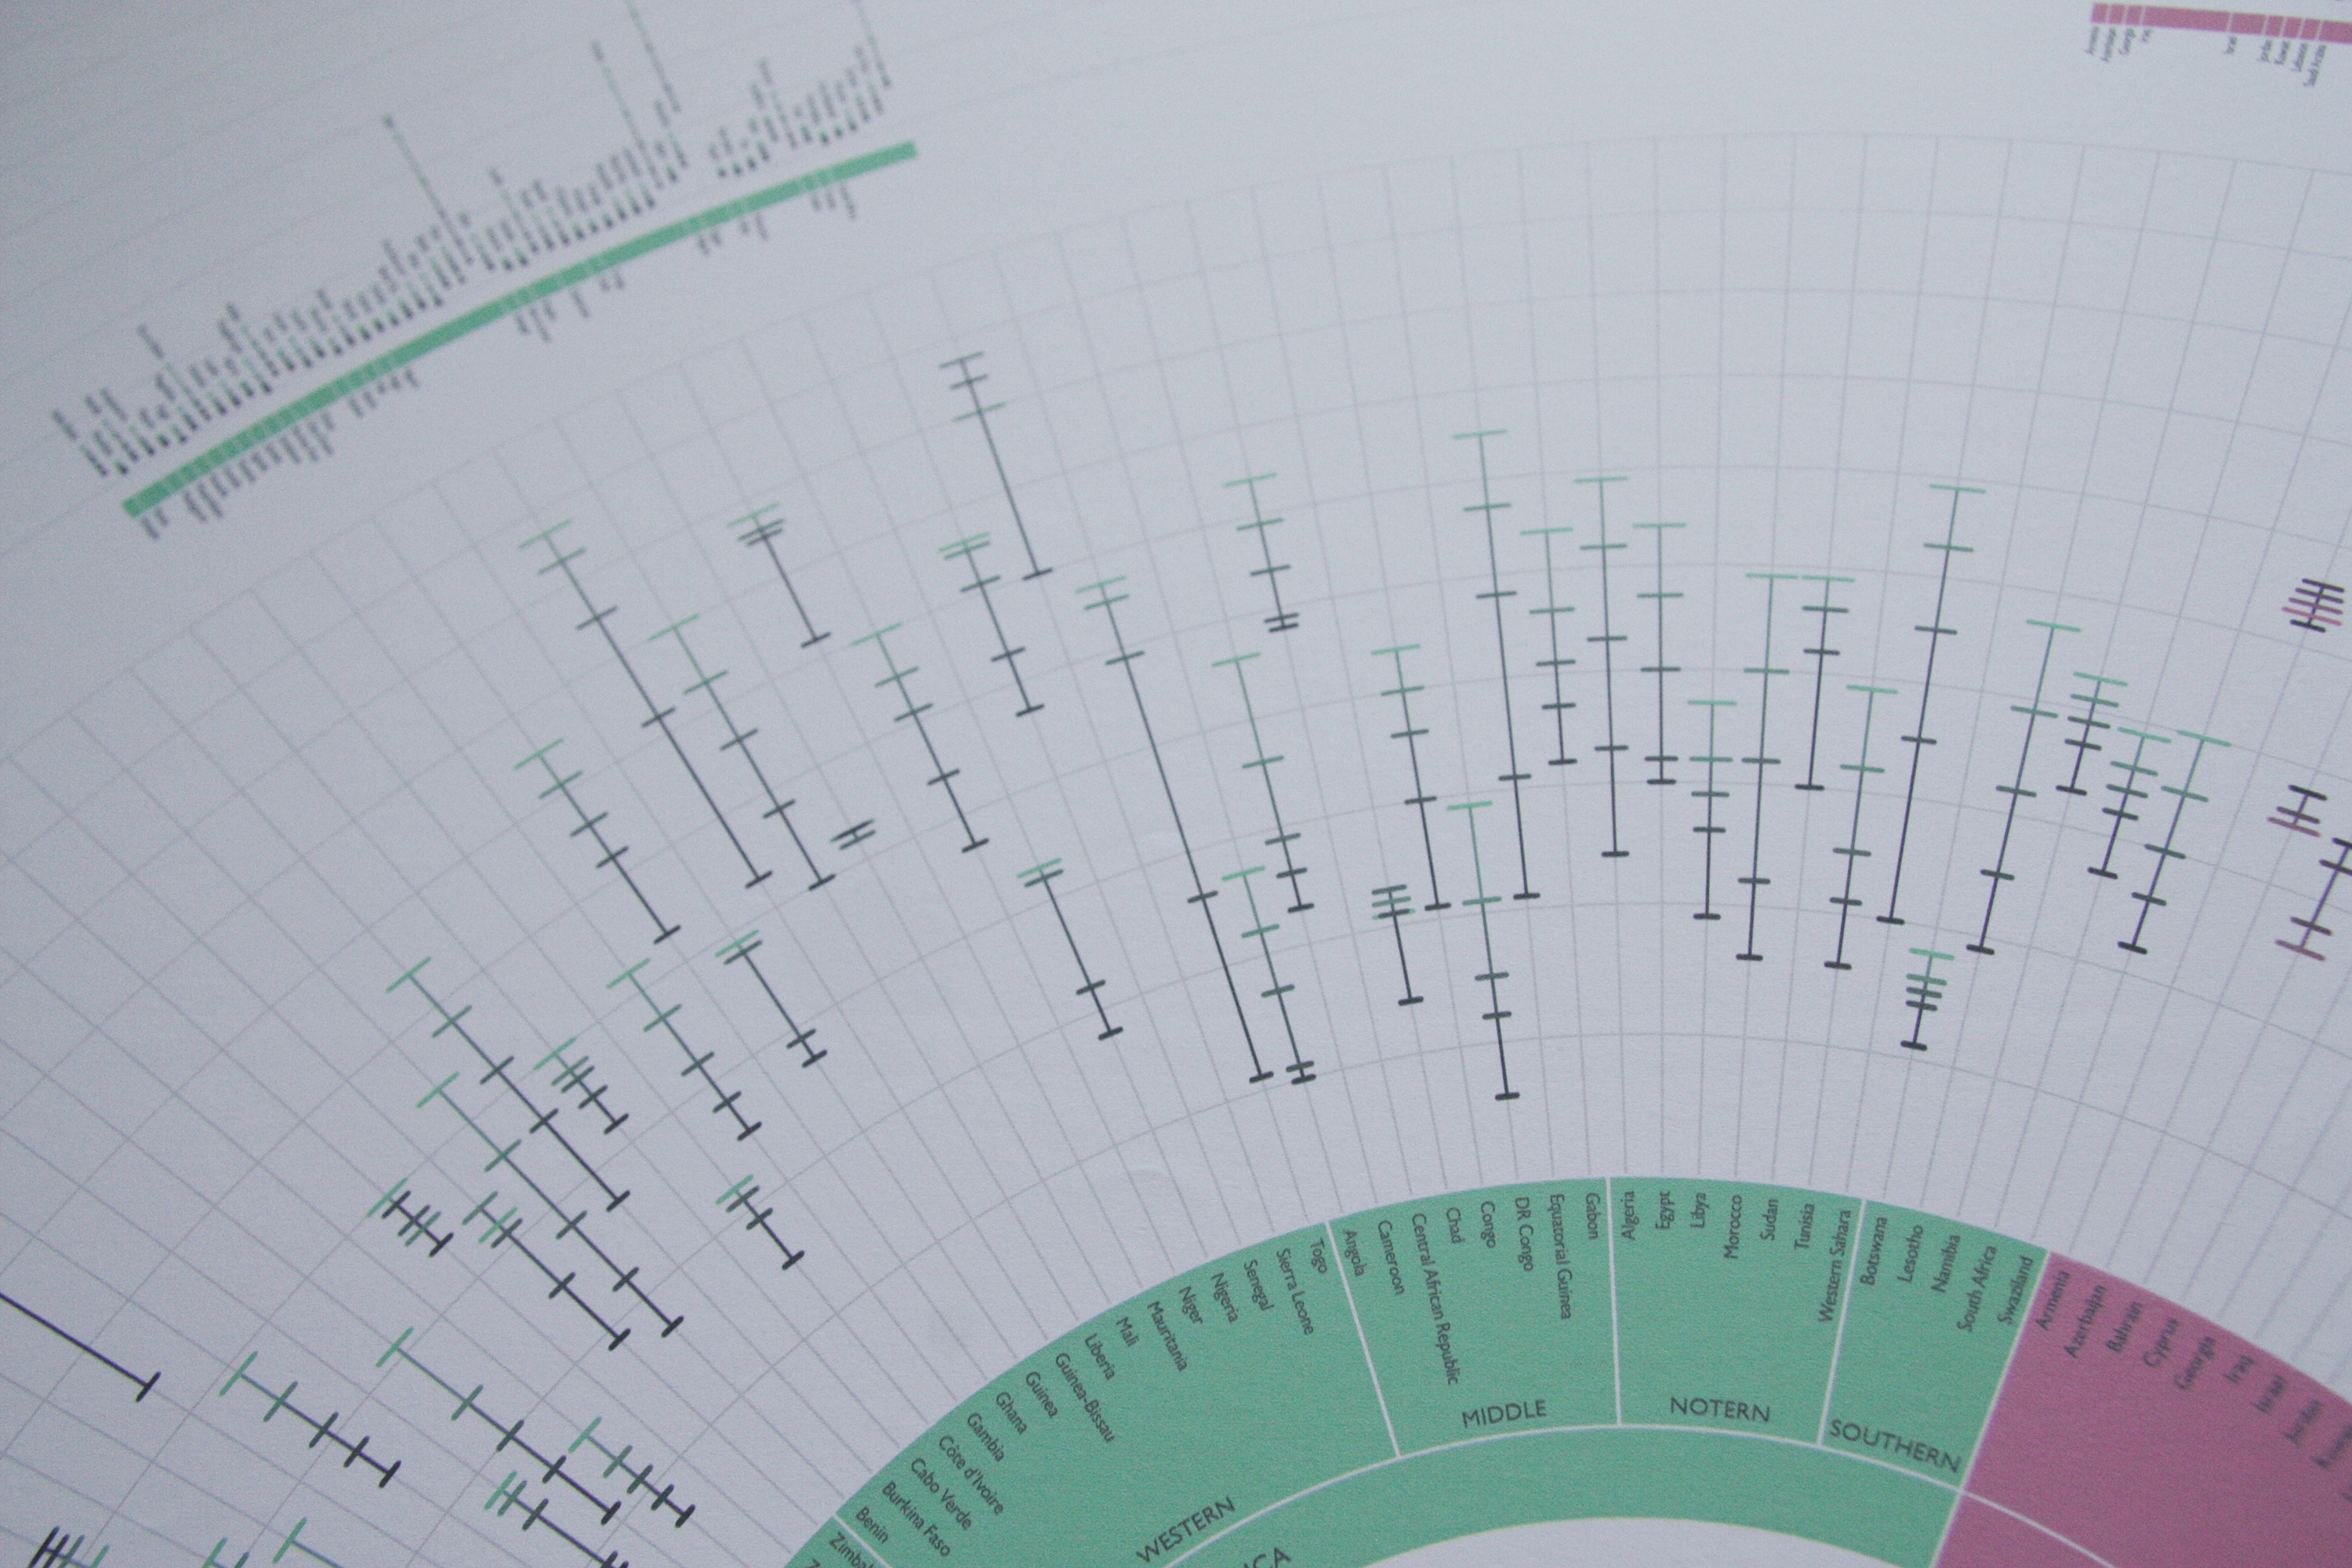
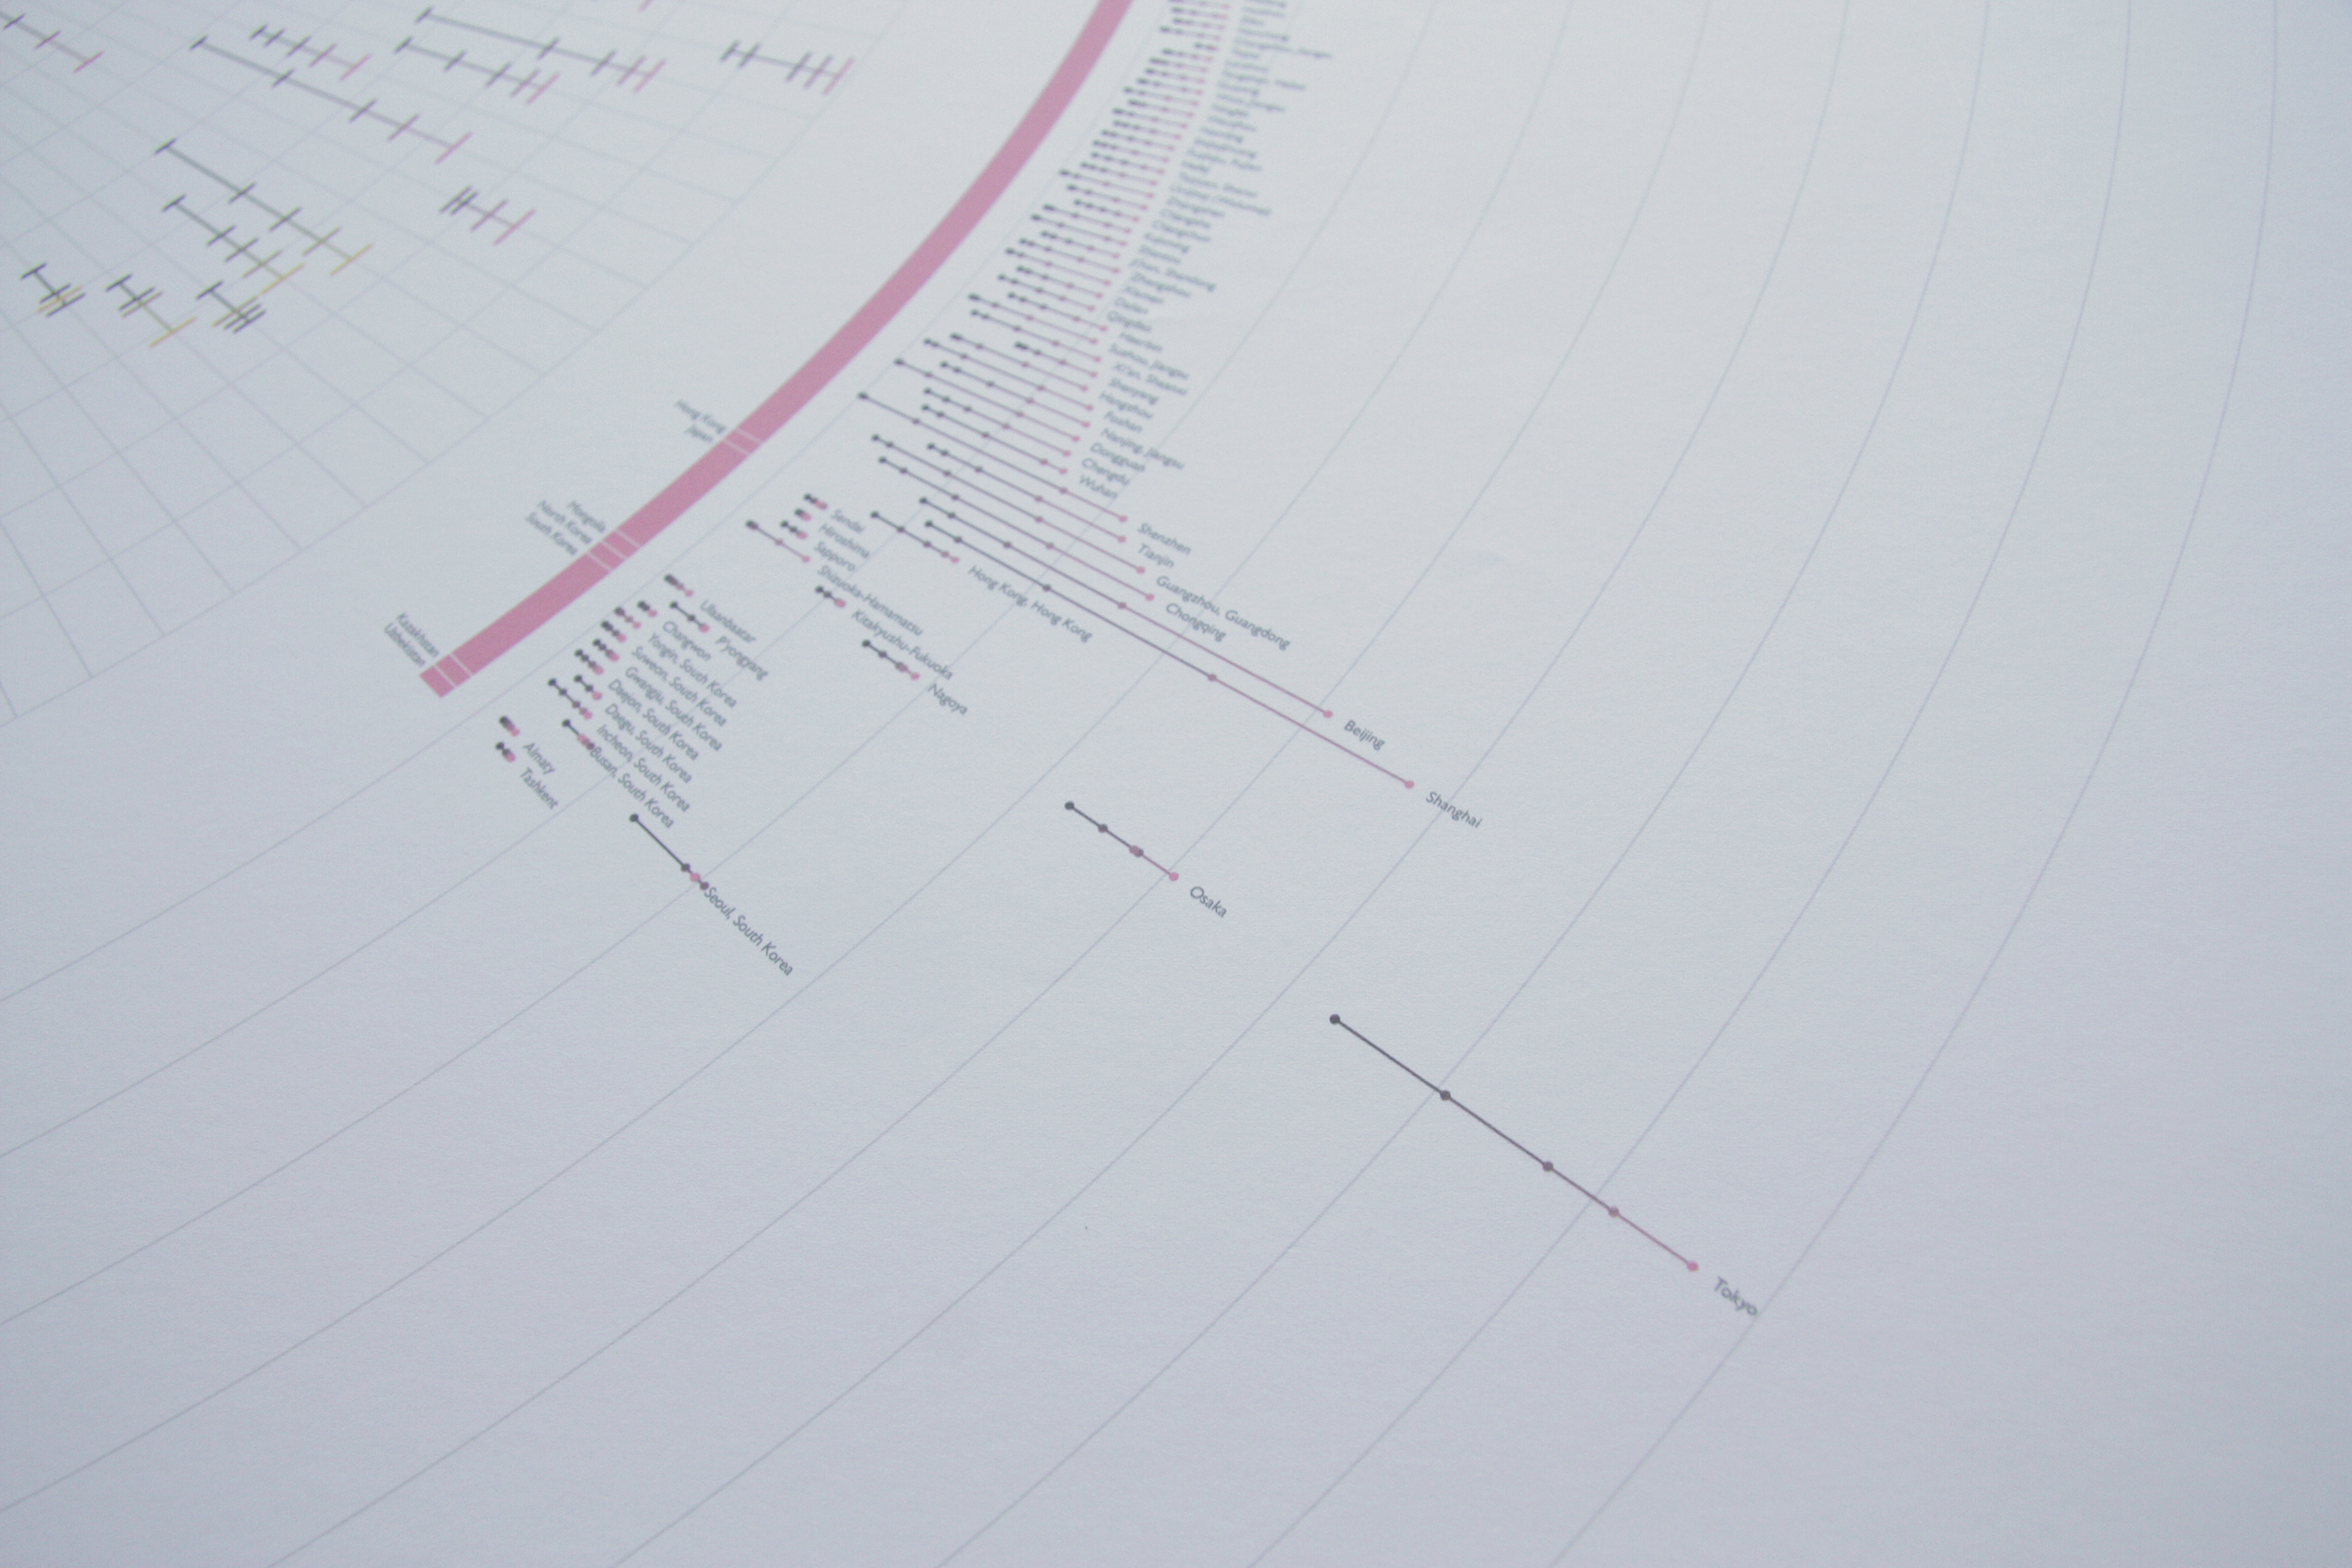
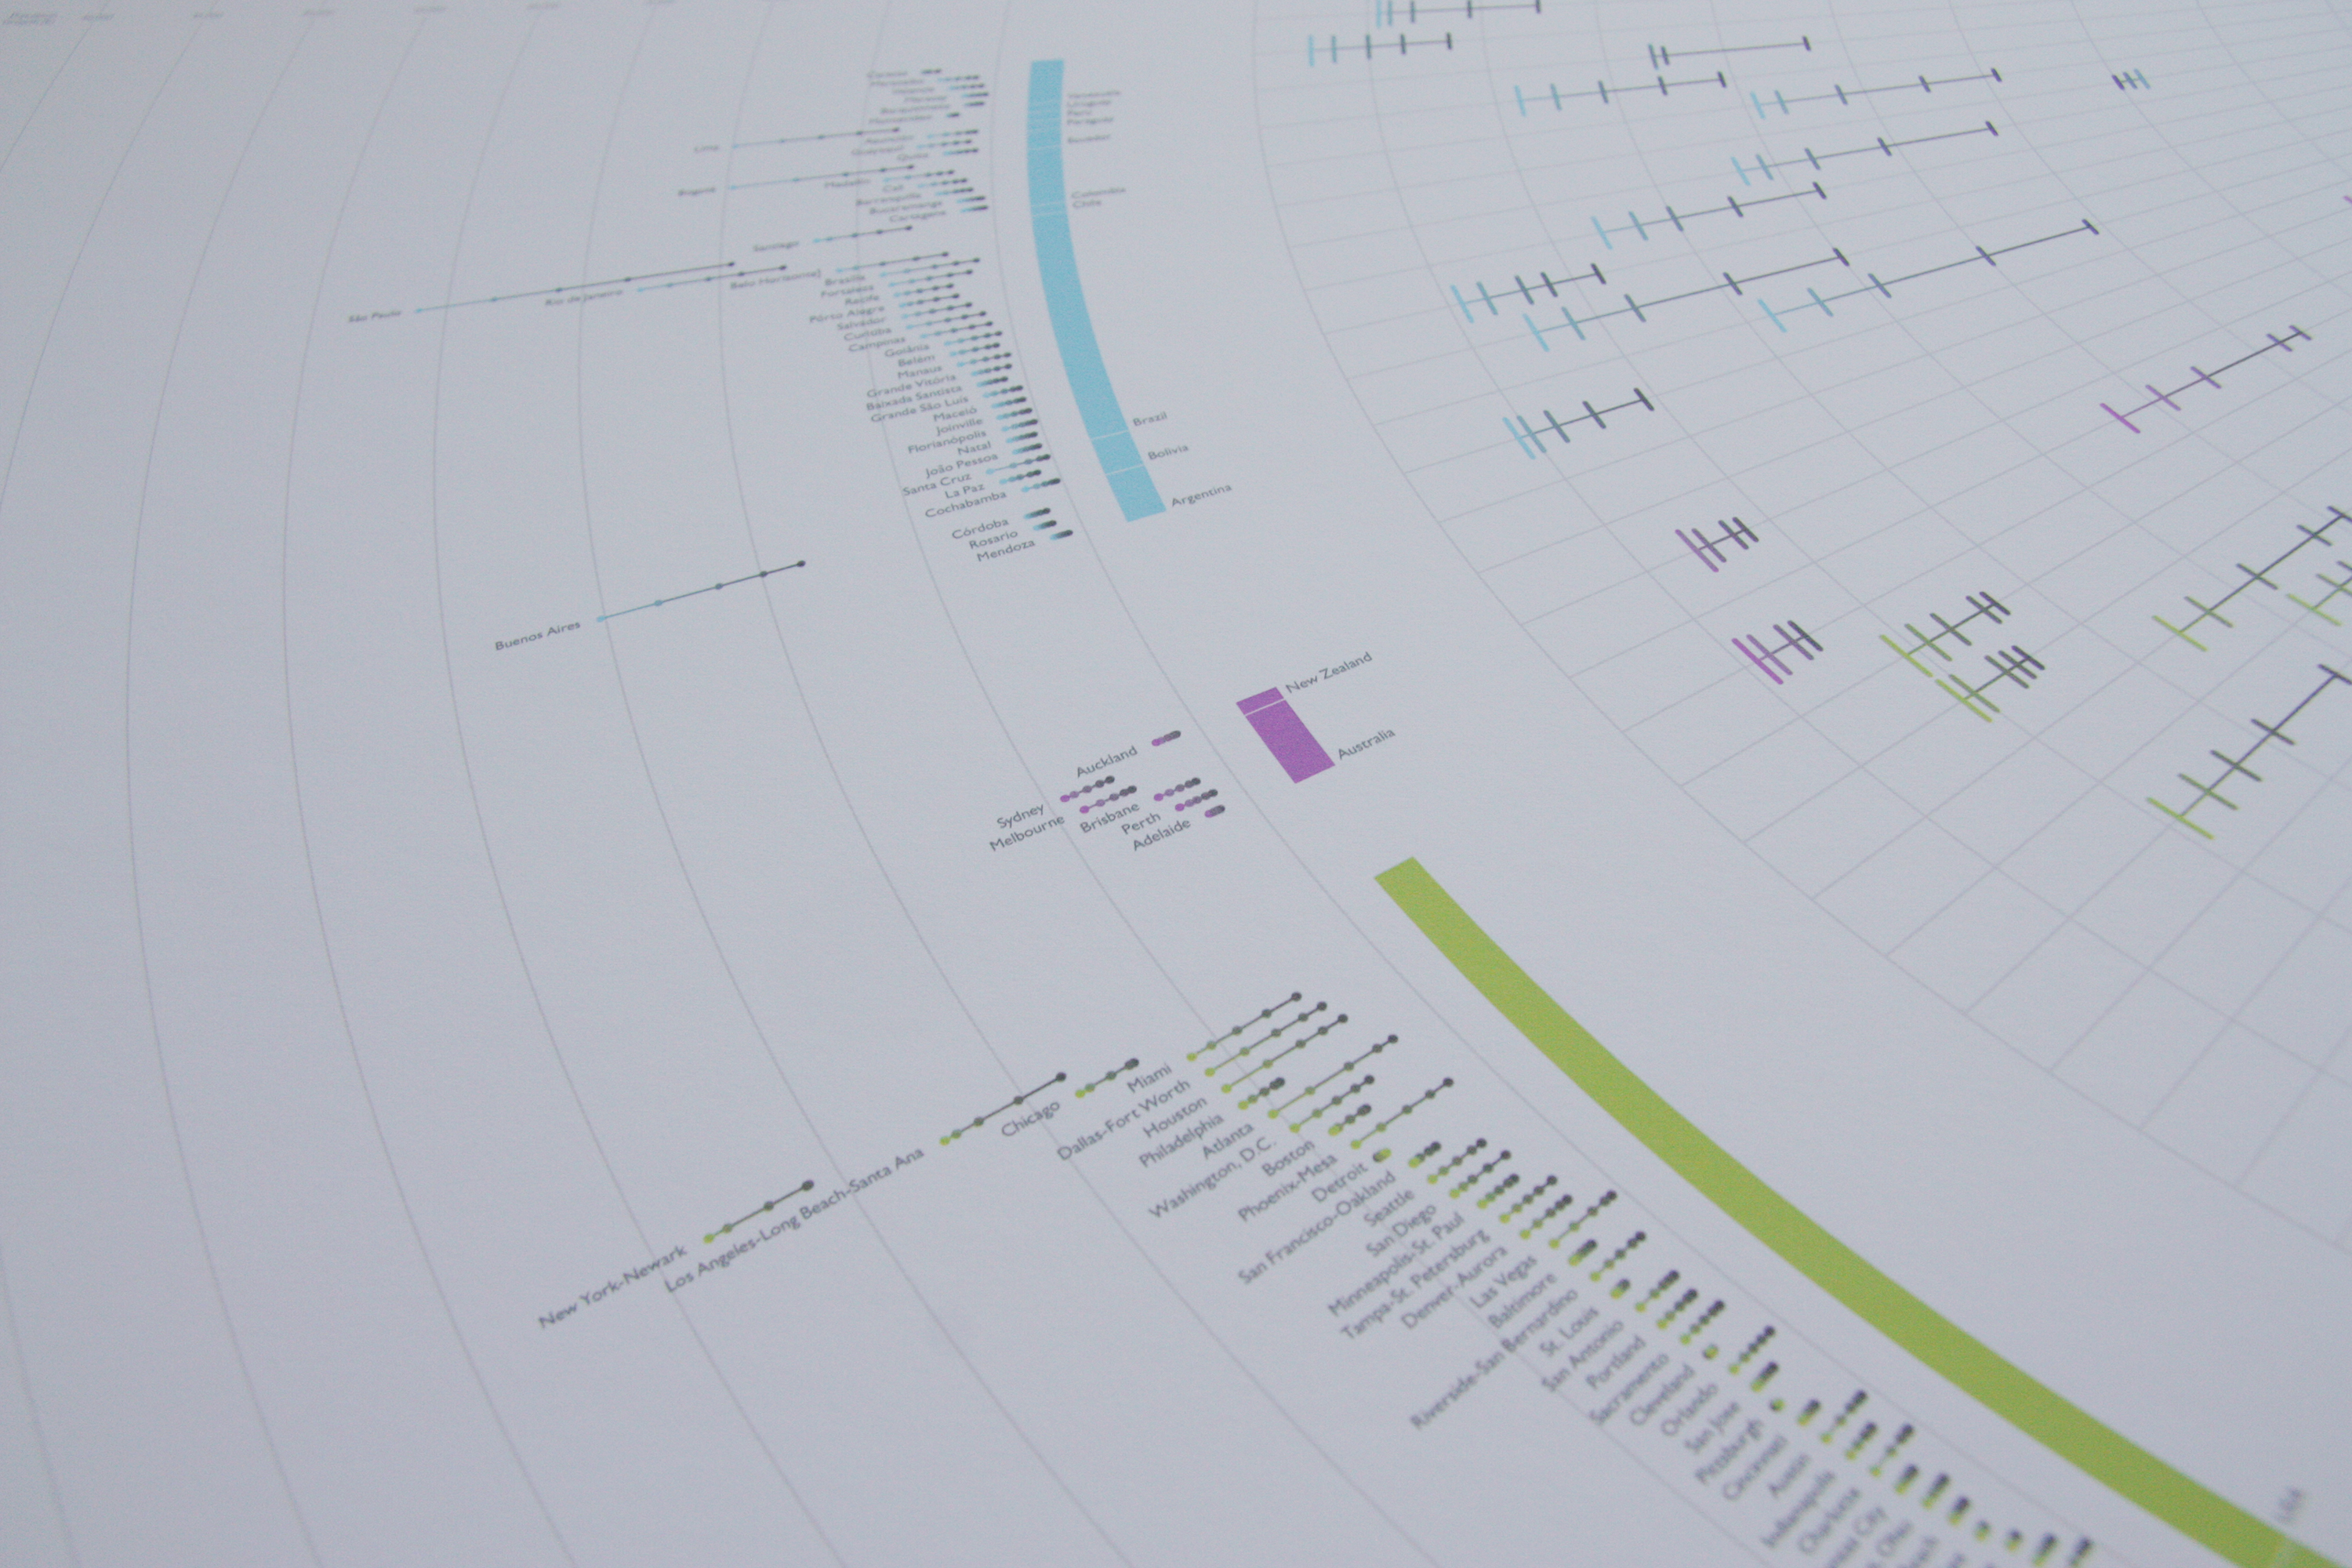
Cities we live in shows visualized data regarding changes in both urbanization proportions of all the countries with 500,000 inhabitants or more, and top 500 biggest urban agglomerations of every decade from 1975 to 2015. This project was initiated from my interest towards urbanism, and I wanted the final poster would reflect how much one city has been expanded in terms of its population. The first thing I did was visualizing the data of populations in the top biggest 1000 cities. I was able to compare the growth, as well as the rare decline, of each city; however, the problem I encountered was that the changes of many cities were not very recognizable except a few massive cities. So, I’ve decided to cut down the list of cities to 500 and added broader information of it, which is urbanization proportion of each country. As a result, it is better execution because it shows the different sense of urbanization when it comes to either city or country. For instance, Australia has a slightly higher nationwide proportion of urbanization than USA, while USA has more big cities than Australia.