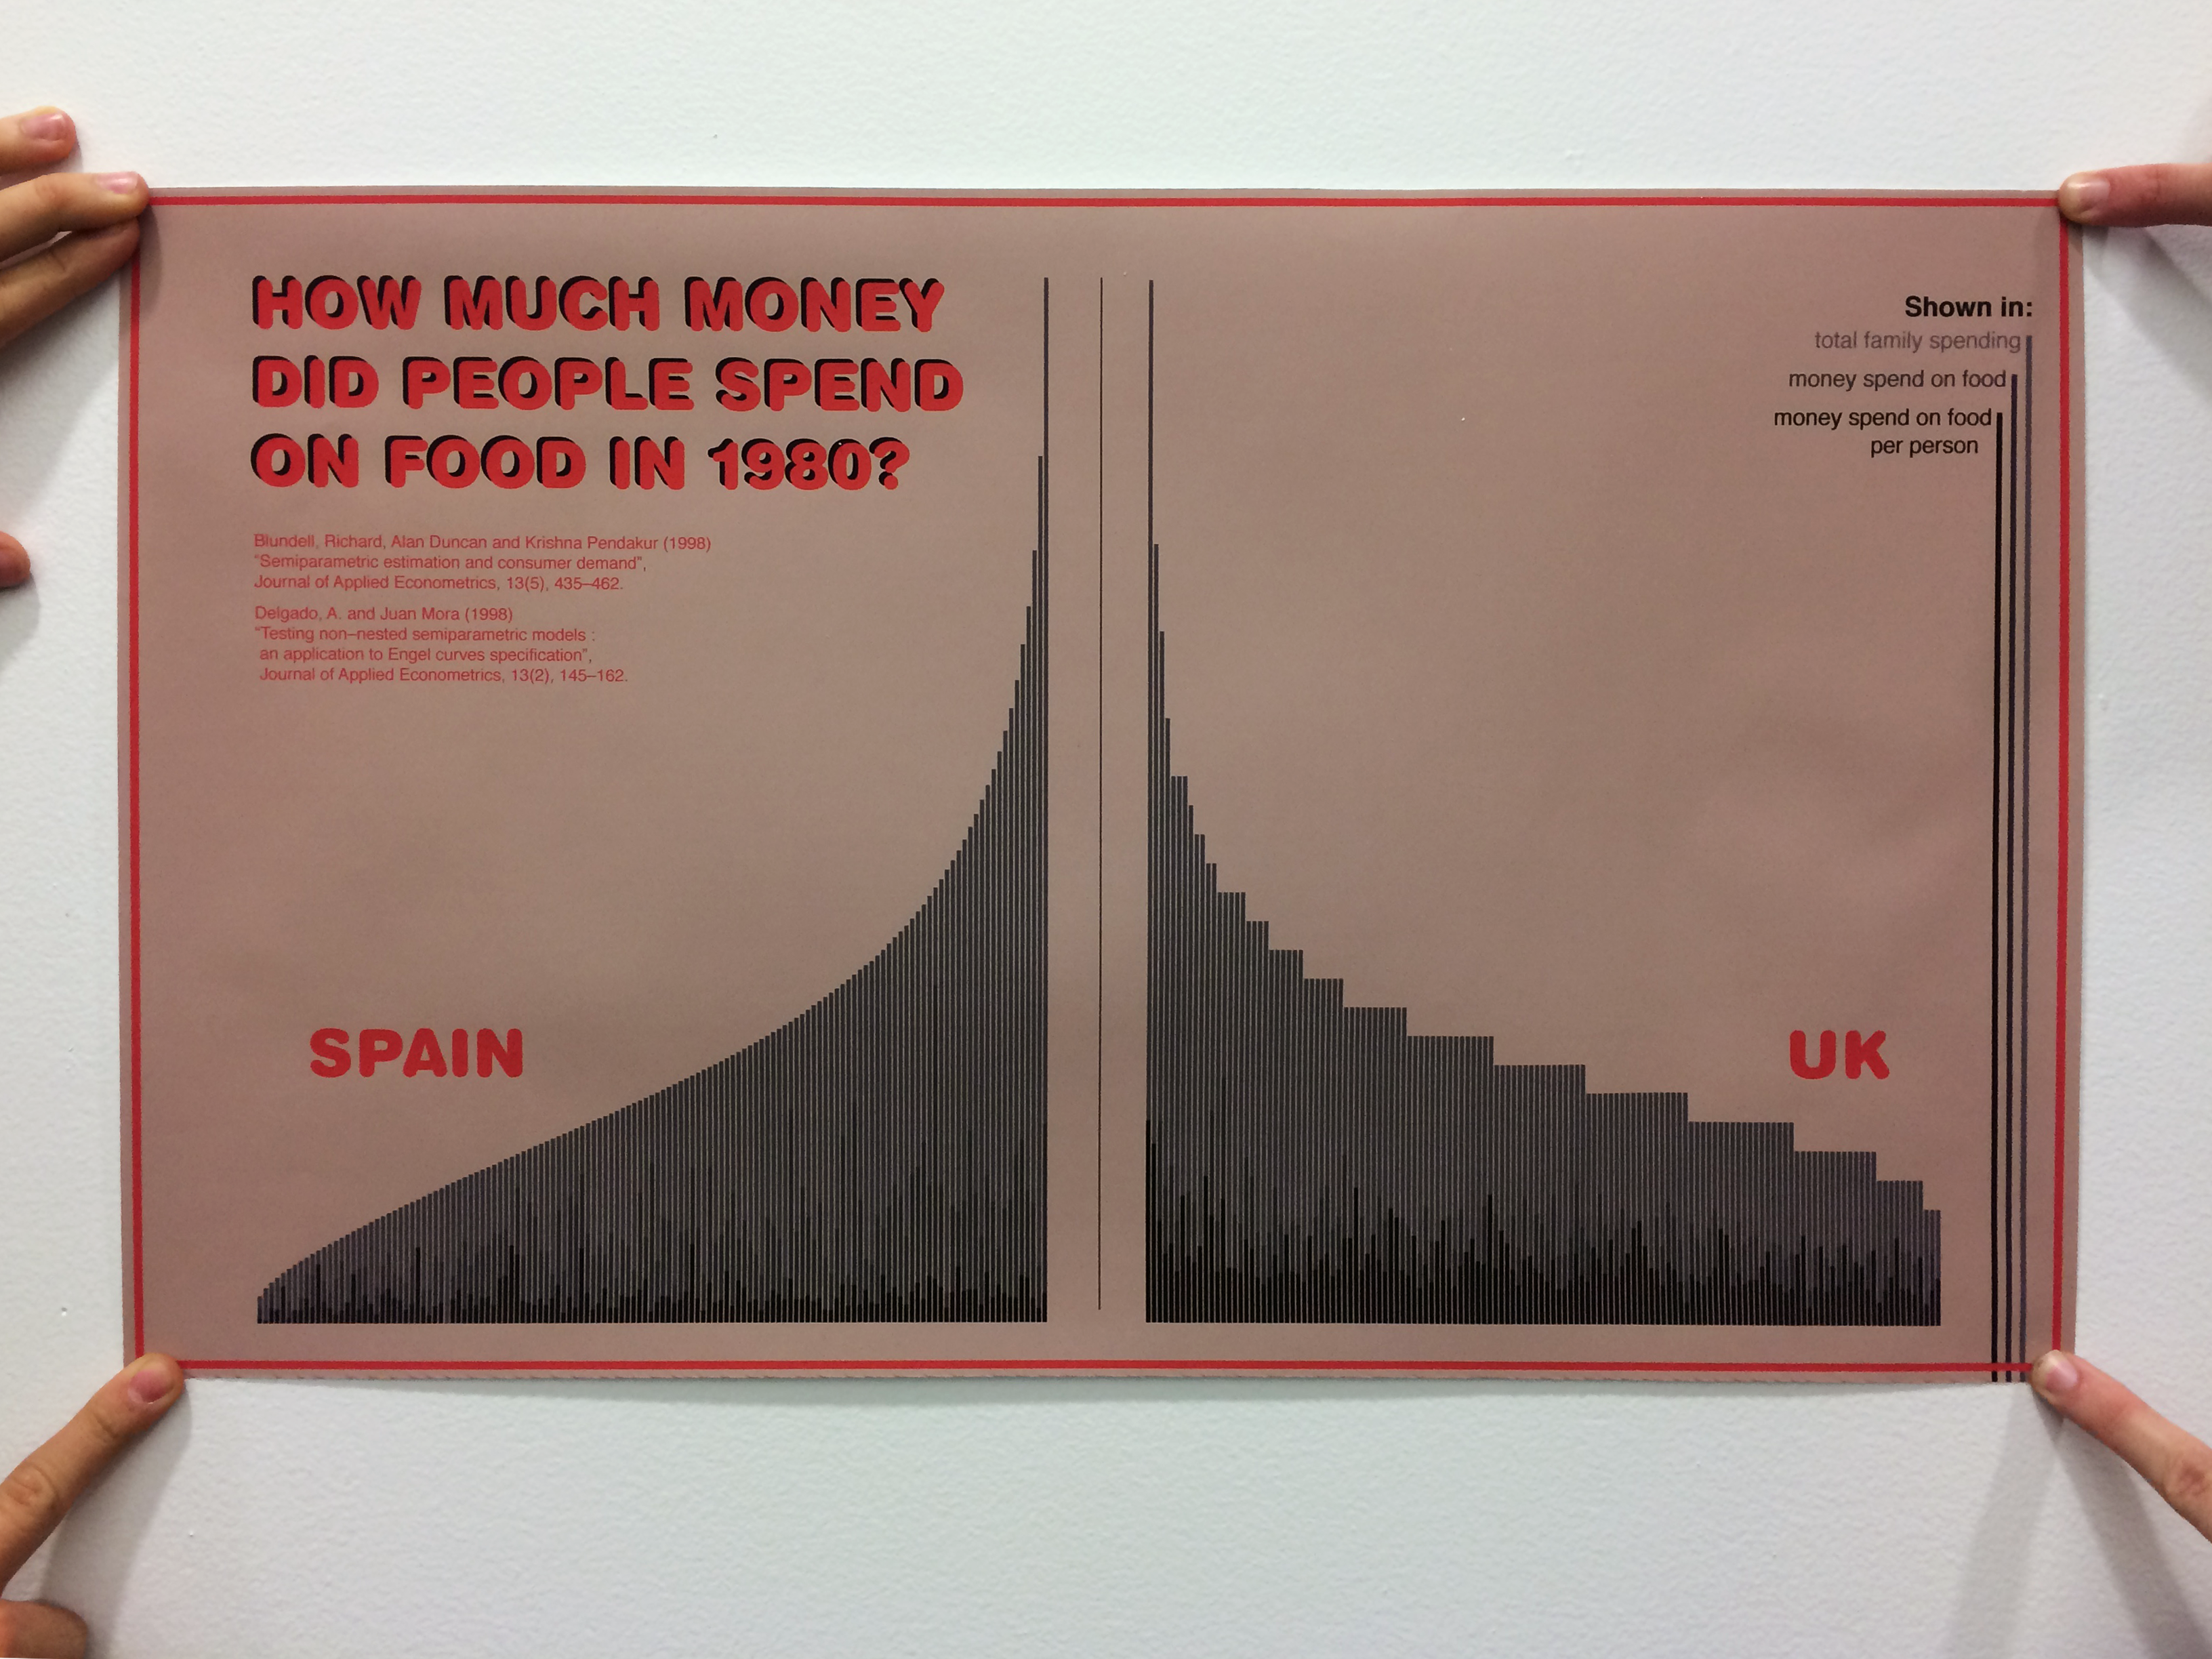
In this assignment the task was to make a data visualization that should at least have 1000 pieces of data. The data I used are showing the amount of money people did spend on food in relation to their income in the UK and in Spain. The poster gives an overview of the cultural differences between the two countries. I used .csv formatted data and handled it with processing and illustrator.