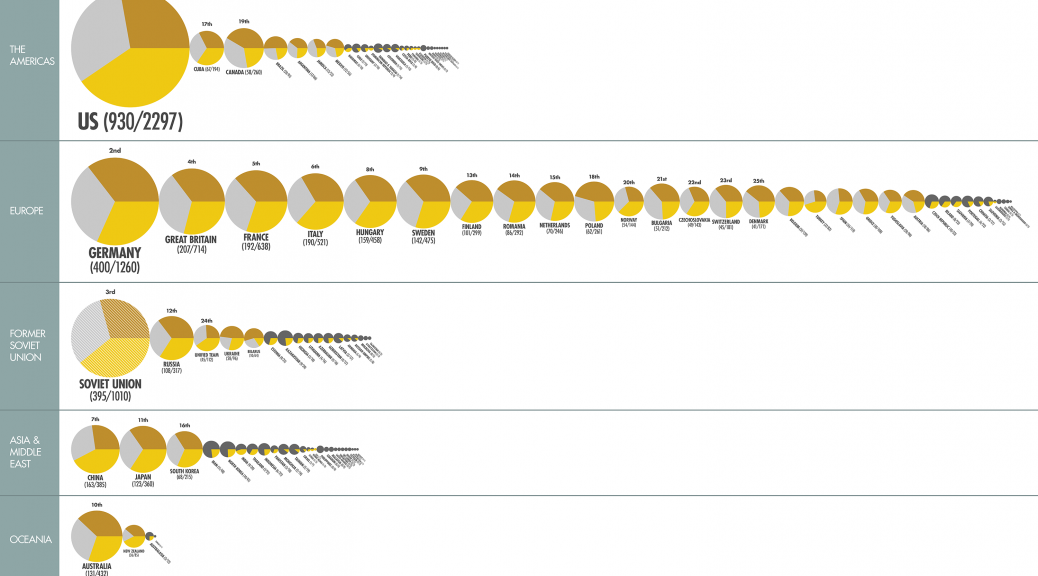
Original data visualization: Atlas of Olympic Success(The Guardian)
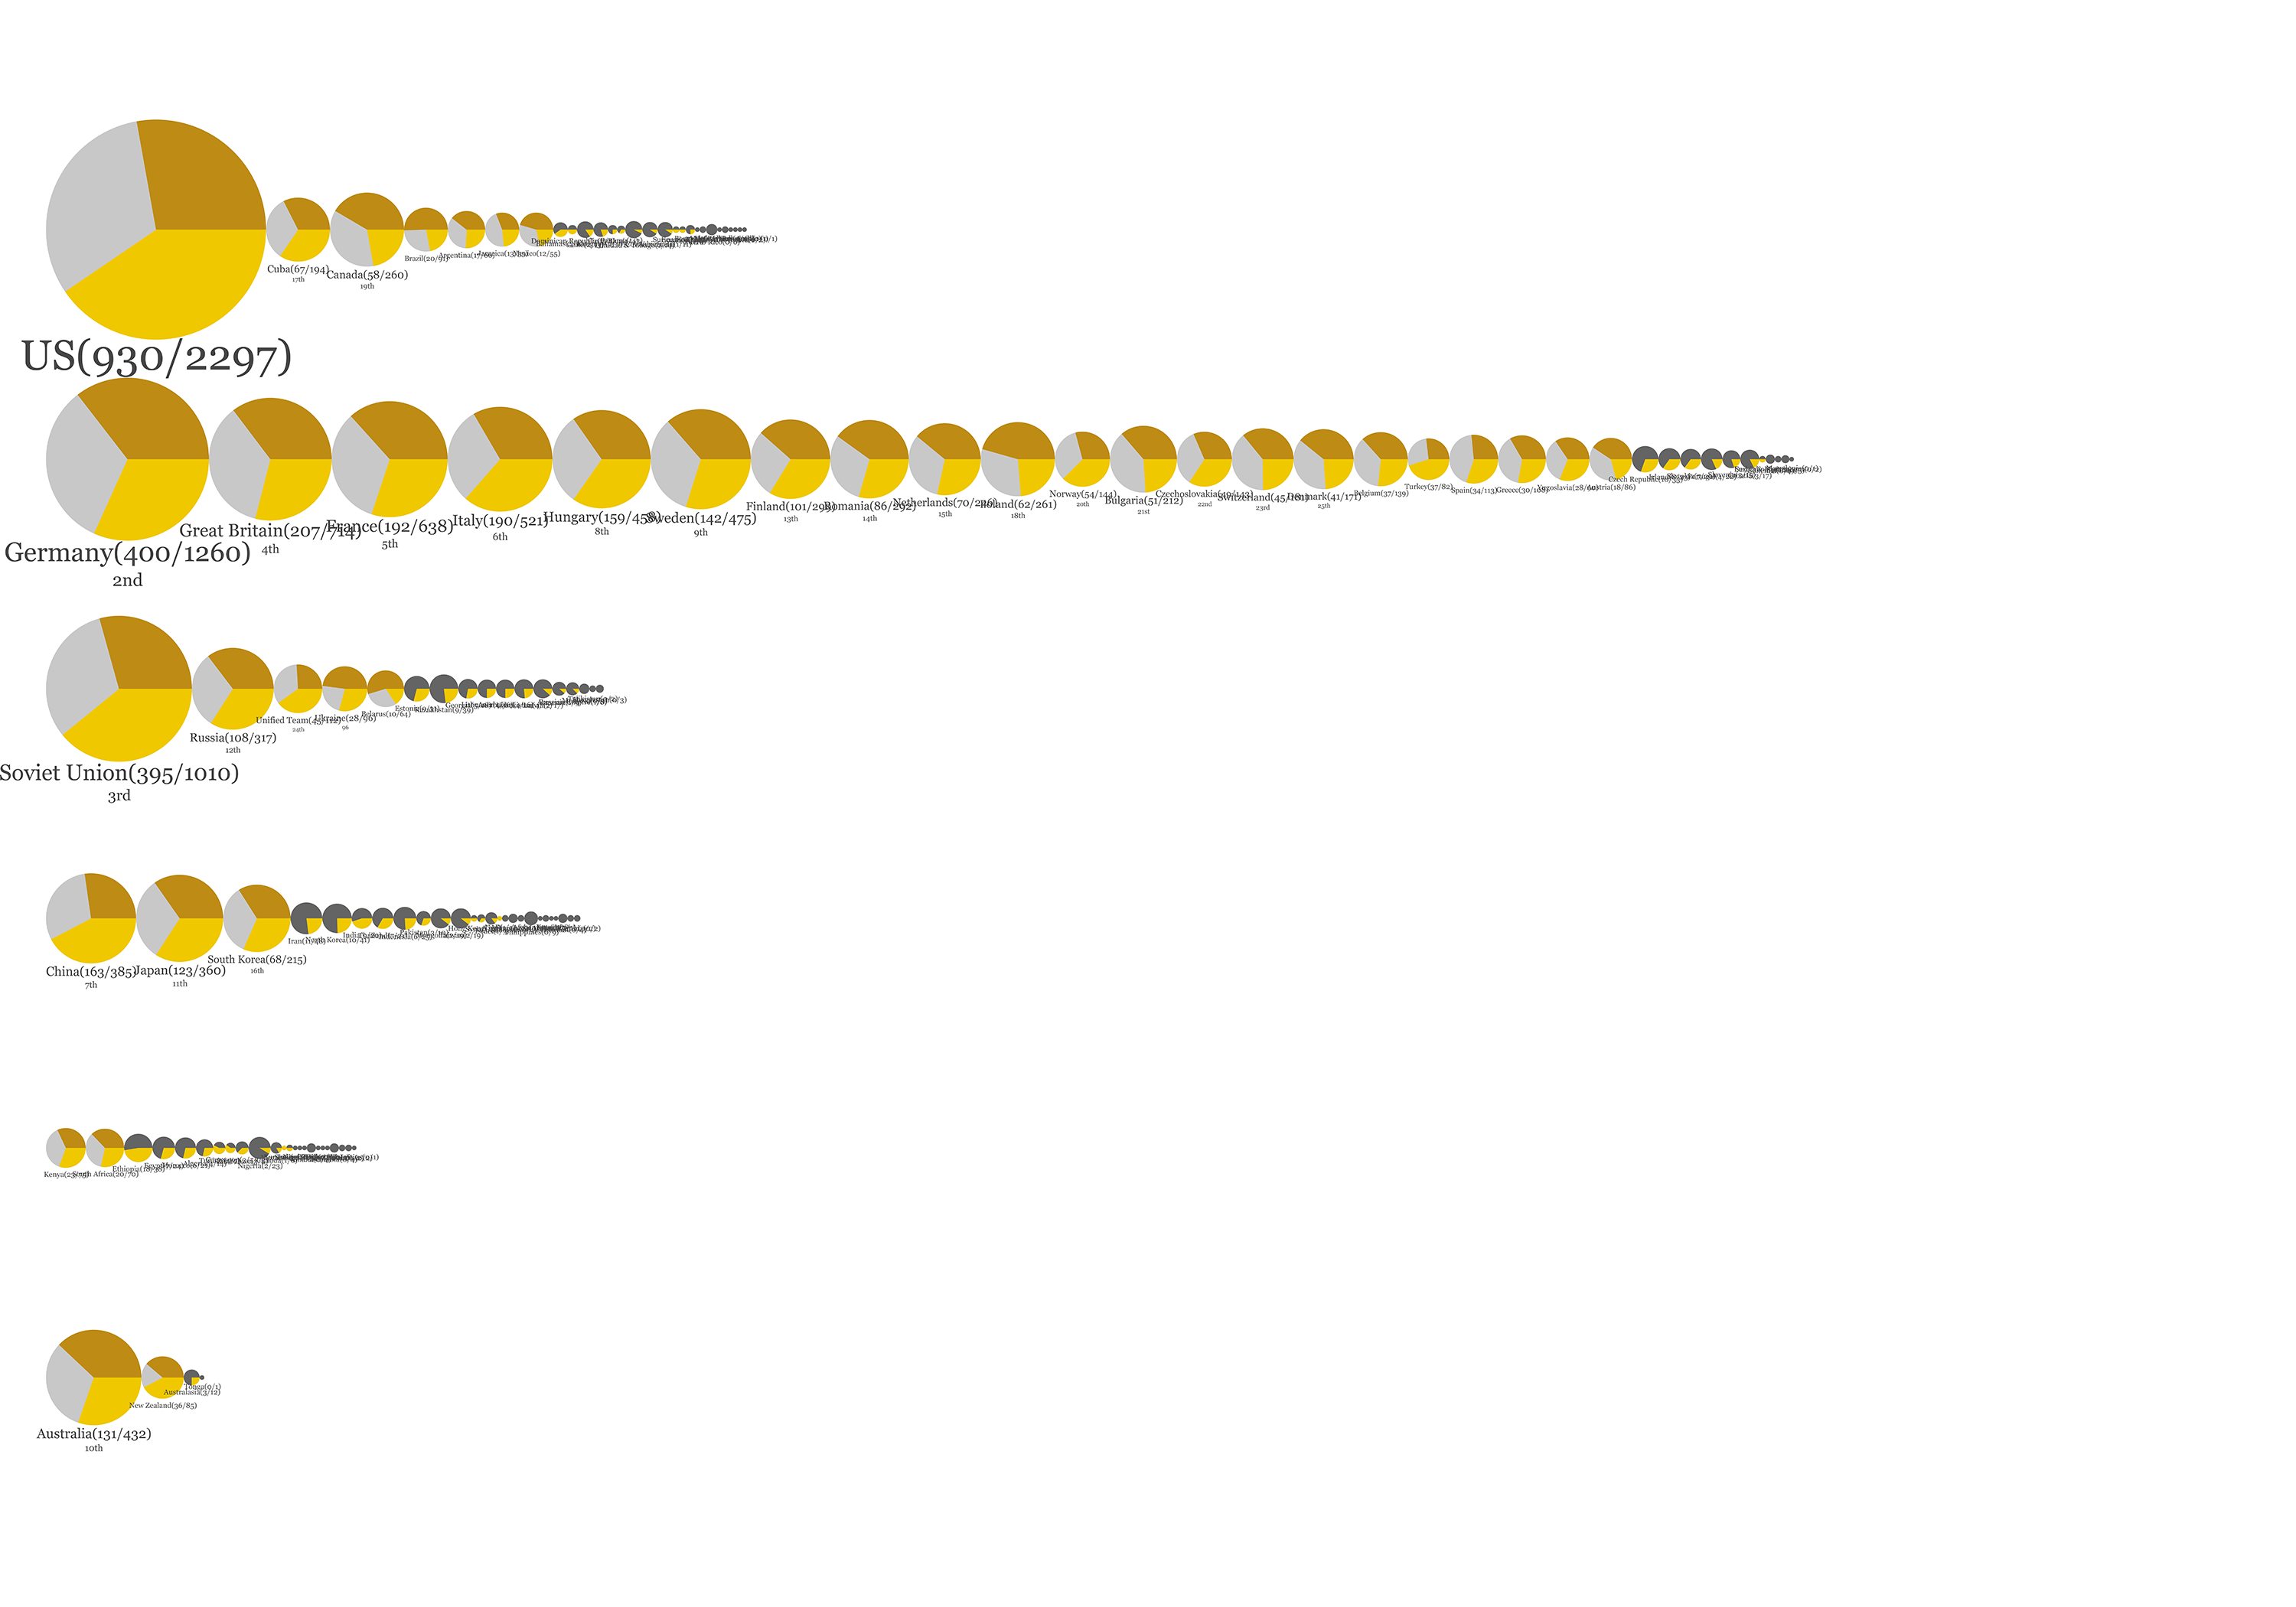
After Processing: olympic
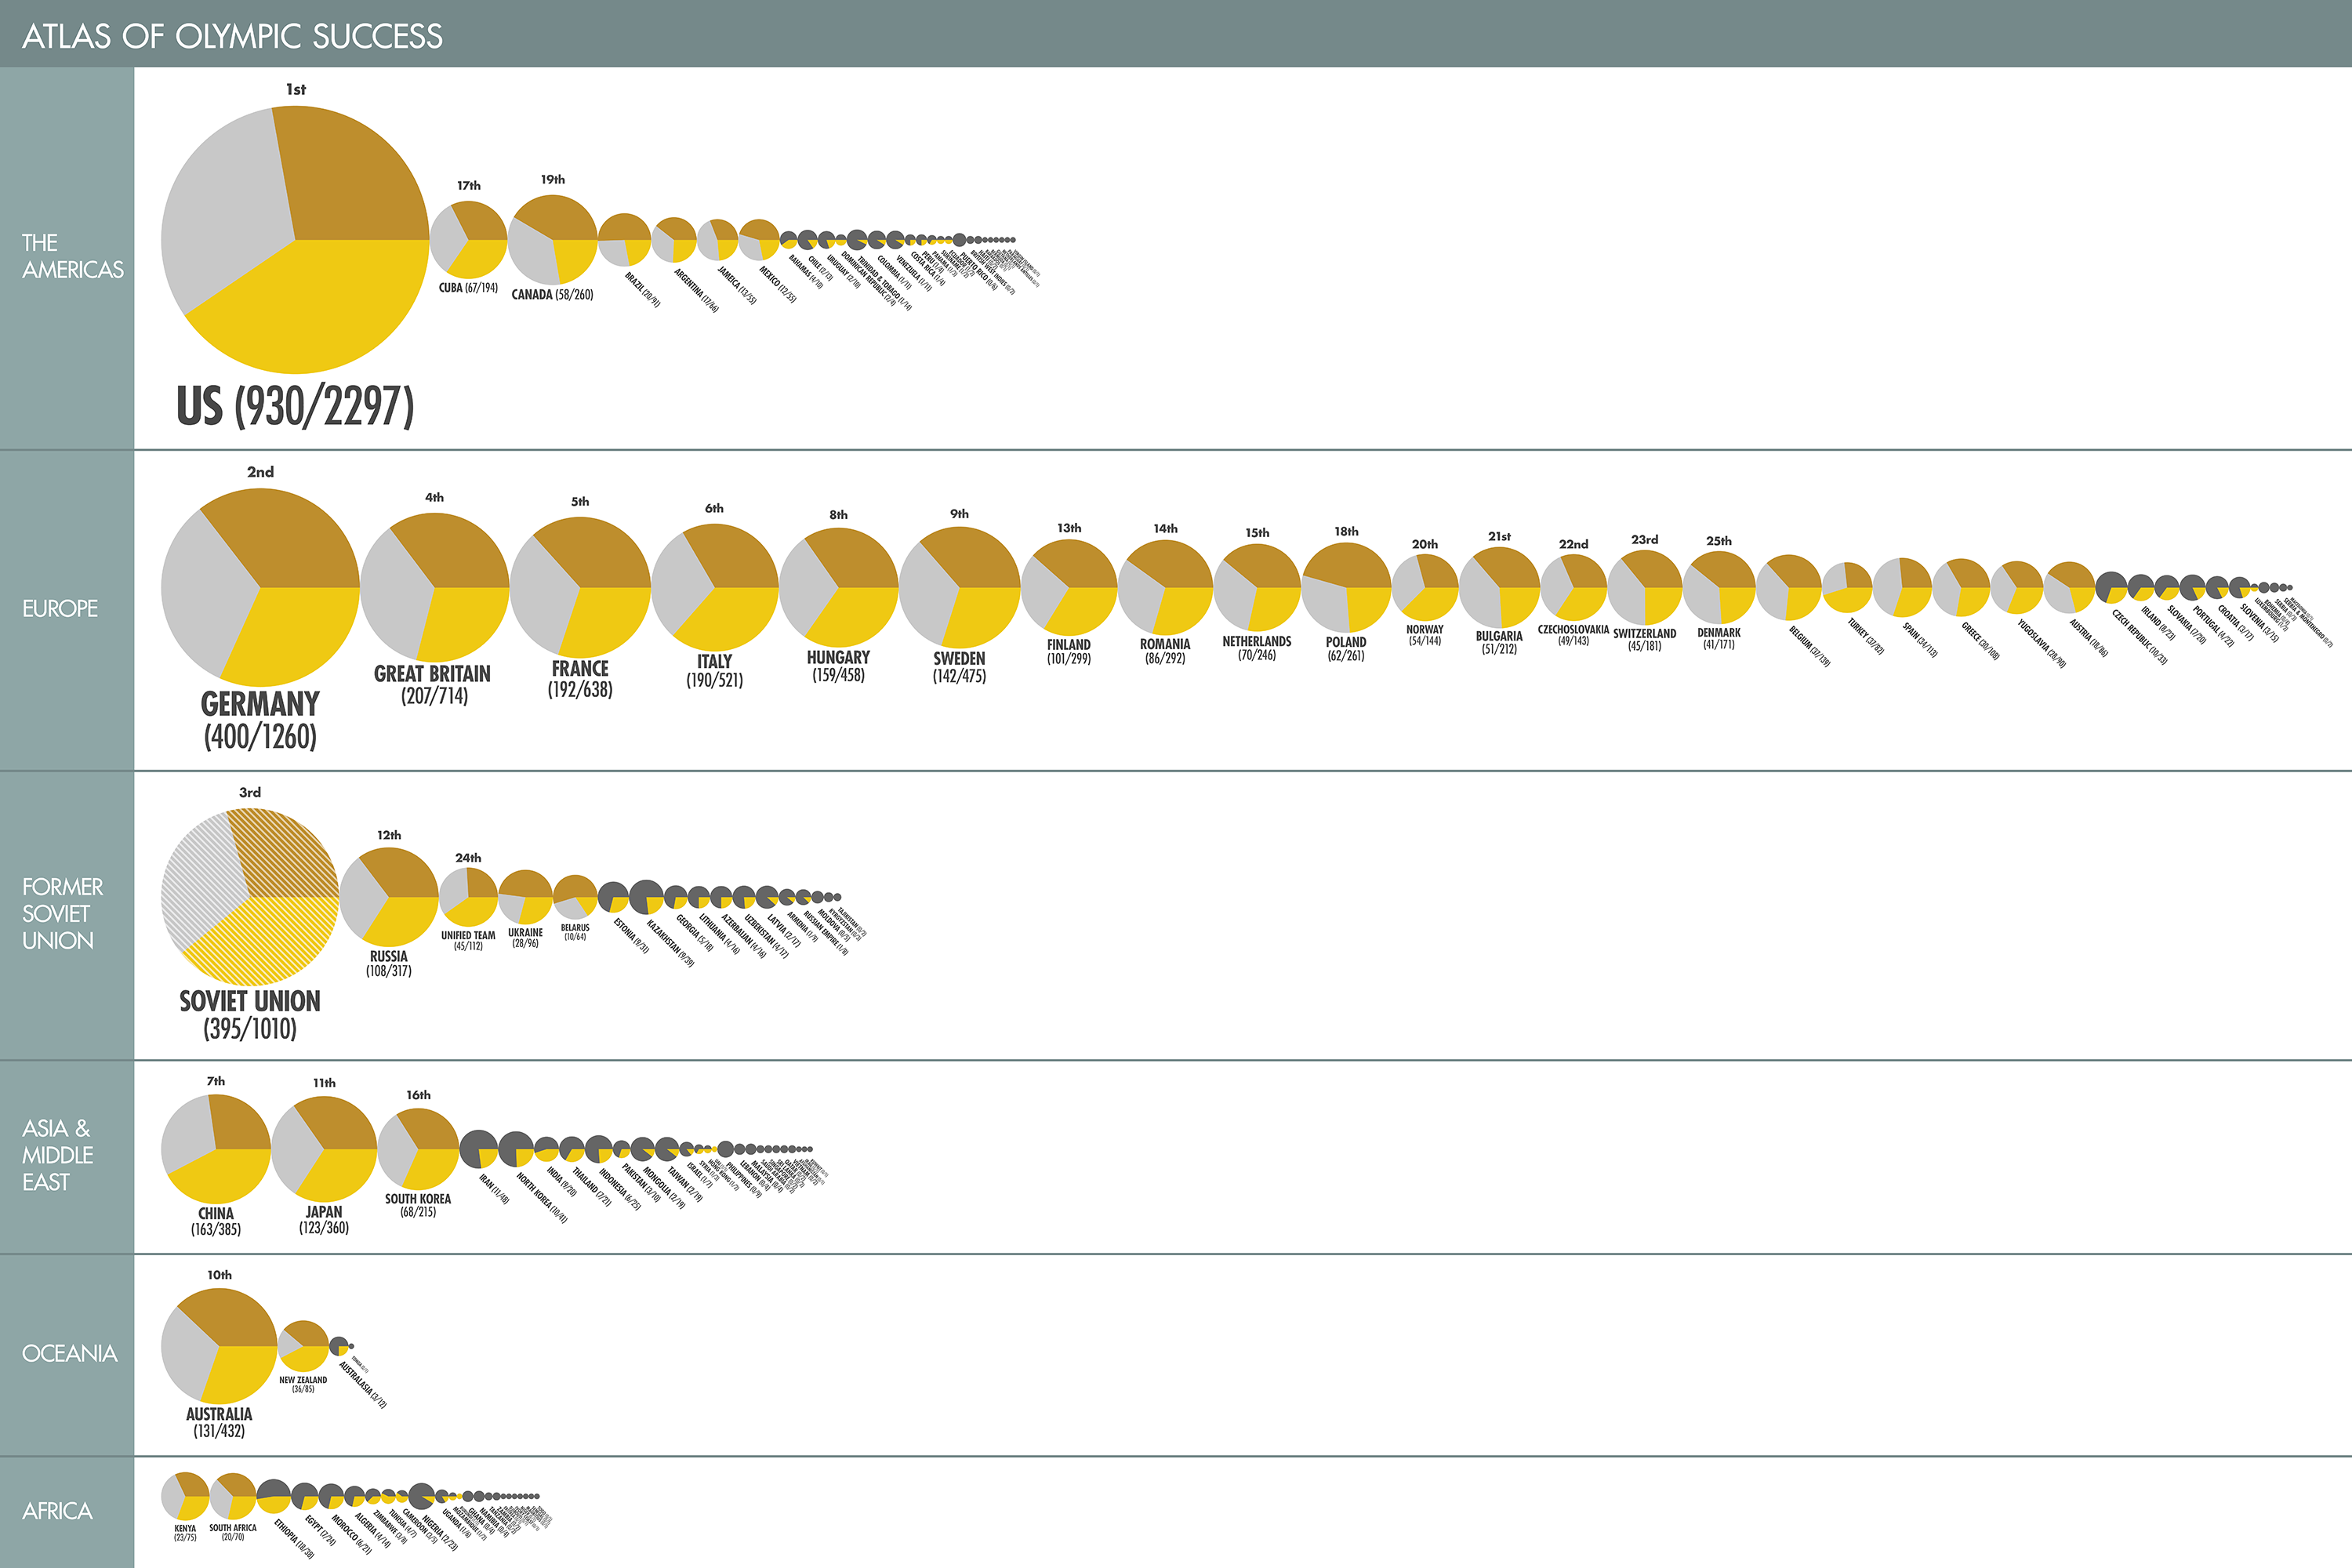 After Illustrator: olympic.pdf
The Guardian visualized how many medals have been won by each country since the beginning of the modern Olympic. The infographic can be simply divided into two parts, and I took out only the upper part which deals with a number of medals each country has been awarded. In the original infographic, the size of each circle represents the number of medals that one country has won, and circles are mapped out according to their geographic location. I keep the circular shape, but instead of showing only gold medals inside the total medals, I broke the circle into three pies which reflect gold medals, silver medals and bronze medals individually. Also, I lined up the circle according continents the countries belong to. I was struggling with leaving texts editable when I exported the code to a pdf file, but I found one example on Google so I made use of it.